There are a plethora of methods to assess whether an investment vehicle is worth buying into or not. Perhaps one of the simplest is to take one portfolio-wise indicator per value, growth, and quality factors and assess what story they are telling. A combination that works nice for portfolios heavy in financial stocks (which is the case with the bulk of ETFs I have analyzed to date) is the earnings yield, Return on Equity, and forward EPS growth rate. The trio allows for a quick understanding of whether a fund’s equity basket is adequately positioned for the current environment. Roughly speaking, an EY as strong as possible, over 20% ROE, and mid-single-digit EPS growth rate should work for hawkish periods, while a low single-digit yield together with growth rates well above 10% (the higher, the better) is a solid proposition for periods of easing.
The FlexShares Quality Dividend Defensive Index Fund ETF (NYSEARCA:QDEF), a fund I previously discussed in May in a note with a principally neutral tone, is currently offering an ROE of almost 105%. Assuming it is also sporting an overall adequate earnings yield that comes together with a low-volatility ingredient, a hypothesis can be made that QDEF should be considered to prepare for the interest rates potentially remaining higher for longer. However, this is far from the whole story.
Revisiting the strategy
Tracking the Northern Trust Quality Dividend Defensive Index, QDEF has a strategy fairly close to that of the FlexShares Quality Dividend Index Fund ETF (QDF), which I have reviewed just recently. To corroborate, these portfolios have an 81% overlap, as per my calculations. Nevertheless, there is a meaningful difference, namely QDEF’s tilt towards less volatile stocks.
As clarified in the summary prospectus, the index
…is designed to reflect the performance of a selection of companies that, in aggregate, provide exposure to a high quality income-oriented universe of long-only U.S. equity securities, with an emphasis on long-term capital growth and a targeted overall beta that is generally between 0.5 to 1.0 times that of the Northern Trust 1250 Index.
Precisely like in the case of QDF’s underlying index, companies that do not pay a dividend are not welcome. Also, those “in the lowest quintile of quality based on a proprietary scoring model” are shown the door very early in the selection process. This model includes metrics in the three categories:
(i) management efficiency (e.g., corporate finance activities and corporate governance); (ii) profitability (e.g., reliability and sustainability of financial performance); and (iii) cash flow (e.g., cash flow generation).
ROE that QDEF’s portfolio currently has is partly the consequence of these strict quality criteria. Another factor which I believe has contributed is the optimization process (involving constituent selection and weighting), which is supposed to
(a) maximize the overall quality score relative to the Parent Index, (b) attain an aggregate dividend yield in excess of the Parent Index and (c) achieve the desired beta target.
There are other considerations detailed in the prospectus. The index is reconstituted quarterly; assuming rather stringent criteria constituents must meet to qualify or retain their place, a turnover of 47% is expectable.
Factor exposure changes since the previous note. A supersized ROE is misleading
As of November 9, QDEF had a portfolio of 127 companies, with the overlap with the basket as of May 26 being about 77%. Neither Apple (AAPL) nor Microsoft (MSFT), tech bellwethers the fund heavily relied on in May, have lost their places since then, still being the top duo with an 8% and 6.3% weight, respectively.
The table below is supposed to provide an overview of QDEF’s exposure to style factors, including size, value, growth, quality, and low volatility.
| Metric | November | May |
| Market Cap | $536.49 billion | $527.52 billion |
| EY | 4.75% | 5.57% |
| P/S | 5.79 | 5.96 |
| Fwd EPS | 6.06% | 4.78% |
| Fwd Revenue | 5.58% | 4.73% |
| ROE | 104.7% | 87.42% |
| ROA | 11.65% | 12.50% |
| 24M beta | 0.86 | 0.85 |
| 60M beta | 0.88 | 0.854 |
| Quant Valuation B- or higher | 8.93% | 10.43% |
| Quant Valuation D+ or weaker | 69.22% | 74.74% |
| Quant Profitability B- or higher | 91.9% | 95.2% |
| Quant Profitability D+ or weaker | 1.14% | 1% |
Calculated using data from Seeking Alpha and the fund
The most notable metric here is the gargantuan ROE. There is a temptation to use it together with a 4.75% EY and a 6% forward EPS growth rate, which has even improved since the previous note, as a basis for a bullish thesis. The issue is that it is skewed. At least, it should not be reviewed in isolation. The Debt/Equity ratios can provide the necessary context, as heavy debt decreases shareholder equity and thus artificially boosts ROE.
| Stock | Weight % | Sector | ROE | D/E |
| Home Depot (HD) | 2.86% | Consumer Discretionary | 2,065.27% | 3,707.34% |
| Cencora (COR) | 0.63% | Health Care | 469.81% | 718.53% |
| Kimberly-Clark (KMB) | 0.28% | Consumer Staples | 248.35% | 988.10% |
| Warner Music Group (WMG) | 0.47% | Communication Services | 184.71% | 1,435.79% |
| Apple (AAPL) | 8.04% | Information Technology | 171.95% | 199.42% |
Data from Seeking Alpha and the fund
QDEF’s median ROE (including holdings with negative or absent figures, which account for close to 10% of the net assets) slightly below 20% looks more reliable, but, again, a Buy rating cannot be based on it alone.
Next, we see that the EY (translates into a 21x P/E) has declined slightly, but it still looks mostly adequate. The problem here is a too small share of holdings with a B- Quant Valuation grade or lower, just 8.9% vs. 10.4% previously, which I believe correlates with the increase in the weighted-average market cap.
Quality is certainly nothing short of robust, as illustrated by almost 92% of the holdings with an at least B- Profitability grade. However, I still see little to no reason to pay $21 per $1 of net profit delivered by a portfolio with only mid-single-digit EPS and revenue growth rates, especially considering 16.7% of the companies represented will have to figure out how to tackle pressures on the top line and subsequent sales contraction going forward (as per pundits’ estimates).
The silver lining is that QDEF does deliver on the low volatility front, with both 24-month and 60-month beta coefficients being well below 1. But the low-volatility ingredient did little to prop up its performance in the past, as the table below illustrates:
| Portfolio | IVV | IWB | QDEF |
| Initial Balance | $10,000 | $10,000 | $10,000 |
| Final Balance | $35,964 | $34,869 | $29,724 |
| CAGR | 12.54% | 12.22% | 10.58% |
| Stdev | 14.62% | 14.80% | 13.71% |
| Best Year | 32.30% | 32.78% | 33.47% |
| Worst Year | -18.16% | -19.19% | -10.94% |
| Max. Drawdown | -23.93% | -24.57% | -23.22% |
| Sharpe Ratio | 0.81 | 0.78 | 0.72 |
| Sortino Ratio | 1.26 | 1.21 | 1.1 |
| Market Correlation | 1 | 1 | 0.96 |
Data from Portfolio Visualizer
Incepted in December 2012, over the January 2013–October 2023 period, QDEF was able to outperform neither the iShares Core S&P 500 ETF (IVV), nor the iShares Russell 1000 ETF (IWB), even though its standard deviation was expectedly lower.
Speaking of dividends, QDEF’s weighted-average 3-year and 5-year dividend CAGRs did improve, but the yield remains unattractive at 2.6%.
| Portfolio as of | Yield TTM | Div Growth 3Y | Div Growth 5Y |
| May 26 | 2.82% | 9.6% | 10.9% |
| November 9 | 2.6% | 13.7% | 11.1% |
Calculated using data from Seeking Alpha and the fund
A few remarks on performance attribution
It is worth briefly mentioning which companies contributed most to QDEF’s performance since the previous coverage and which were a drag on it.
Seeking Alpha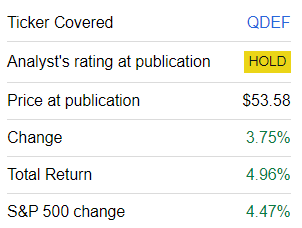
An essential remark is that I analyzed the price returns delivered by the holdings that were both present in the May 26 and November 9 versions of the portfolio.
So, the top five detractors were as follows:
| Holding | % Weight (May 26) | % Price Decline |
| ONE Gas (OGS) | 0.475% | -34.73% |
| General Mills (GIS) | 0.674% | -28.46% |
| Pfizer (PFE) | 0.56% | -26.68% |
| Bristol-Myers Squibb (BMY) | 0.44% | -26.60% |
| Mid-America Apartment Communities (MAA) | 0.443% | -21.86% |
Calculated using data from Seeking Alpha and the fund
The top five contributors are presented below:
| Holding | % Weight (May 26) | % Decline |
| Warner Music Group (WMG) | 0.372% | 23.20% |
| Sirius XM Holdings (SIRI) | 0.386% | 24.73% |
| Eli Lilly and Company (LLY) | 3.505% | 27.99% |
| Constellation Energy (CEG) | 0.547% | 30.49% |
| H&R Block (HRB) | 0.387% | 31.01% |
Final thoughts
QDEF’s supersized ROE is misleading. It is skewed by companies with burdensome borrowings on the balance sheets, with HD being the key contributor. At the same time, both valuation and growth exposures are not attractive enough. The ETF’s 2.23% dividend yield is fairly small. I appreciate the fund’s sophisticated quality-centered dividend strategy with a low volatility ingredient, but there will be no rating upgrade today.
Read the full article here


