WTI crude oil posted its best weekly performance in two months last week despite softer US inflation data, a strong US dollar, and a dismal performance from ex-US equities. While oil supply concerns remain apparent, both WTI and Brent have managed to hold the mid to high $70s per barrel.
The same sort of price resilience is not seen in the relative strength of Energy sector stocks, however. Last Friday, the Energy Select Sector SPDR ETF (XLE) closed at its worst level versus the S&P 500 Trust ETF (SPY) going back to April 2022. Twenty-six-month relative lows is evidence of investors’ preference for tech-related stocks and not those exposed to value and cyclical niches of the global economy.
Nevertheless, I have a buy rating on shares of Exxon Mobil (NYSE:XOM). The stock is stuck in a sideways momentum trend, but its valuation is attractive, and the company continues to produce hefty amounts of free cash flow.
Energy Stocks Stumbling Versus the S&P 500, Fresh 26-Month Relative Lows
Stockcharts.com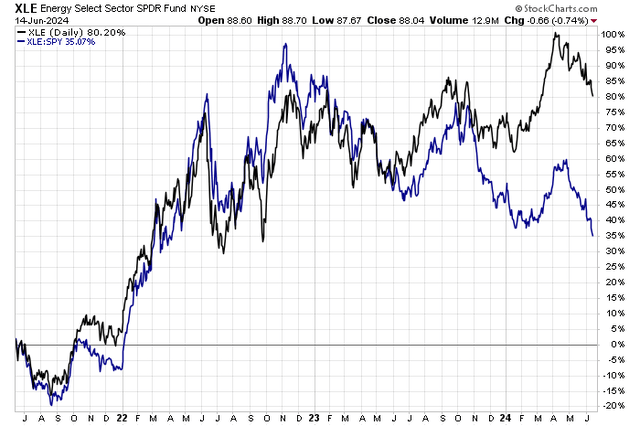
According to Morningstar, Exxon Mobil is an integrated oil and gas company that explores for, produces, and refines oil around the world. In 2023, it produced 2.4 million barrels of liquids and 7.7 billion cubic feet of natural gas per day. At the end of 2023, reserves were 16.9 billion barrels of oil equivalent, 66% of which were liquids. The company is one of the world’s largest refiners with a total global refining capacity of 4.5 million barrels of oil per day and is among the world’s largest manufacturers of commodities and specialty chemicals.
Back in April, XOM reported a mixed set of quarterly results. The biggest US oil company reported Q1 non-GAAP EPS of $2.06, falling short of Wall Street expectations which called for $2.18 of operating per-share earnings. Revenue of $83.1 billion, down 4% compared with year-ago levels, was a solid $1.6 billion beat, however. Oil production was up 2.5% versus Q1 2023 and higher by 0.3% sequentially, though weakness was seen in overall natural gas production. Oil refining margins dropped and softer natural gas prices were a headwind.
Color on Quarter: XOM Oil Production Up, Weaker Gas Figures
Seeking Alpha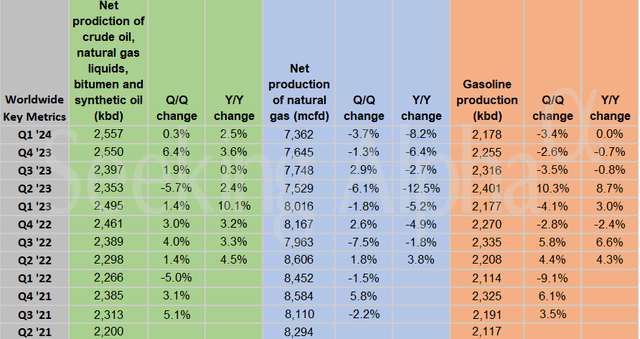
Despite a tough macro backdrop, XOM generated robust cash flow from operations of $14.7 billion, $1 billion above estimates and free cash flow registered $10.1 billion for the quarter. Solid performance from assets in its Guyana operations and disciplined expense management offset tepid energy prices.
The company remains committed to reducing costs by $15 billion through 2027. Moreover, the management team will likely be aggressive in engaging in shareholder-friendly initiatives over the back half of the year with its acquisition of Pioneer having been completed on May 3, 2024. Additionally, XOM’s balance sheet has strengthened lately, with the firm having repaid $1.1 billion of debt. Its debt-to-capital ratio is now 16% while its net debt-to-capital ratio is low at just 3% as of the end of Q1.
XOM’s Strategy Includes Significant Cost-Cutting Efforts
XOM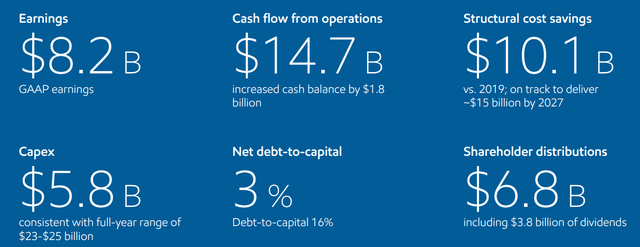
On earnings, analysts expect a 3% annual decline in EPS this year followed by a decent recovery in the out year. By 2026, non-GAAP per-share profits are seen approaching $10. Revenue growth may be tepid over the next few years, though, and much will depend on developments in the global energy market. The company states that it is on track to deliver an additional 50% earnings growth by 2027 compared to 2023, assuming just $60 per barrel (real) on Brent. So, with higher oil prices today, profits could be even larger.
Furthermore, with a dividend yield about two percentage points above that of the S&P 500 and considering the company’s high 7.3% free cash flow yield, the firm is both strong from a profitability standpoint and with respect to rewarding stockholders.
ExxonMobil: Earnings Forecasts & Sellside EPS Revision History
Seeking Alpha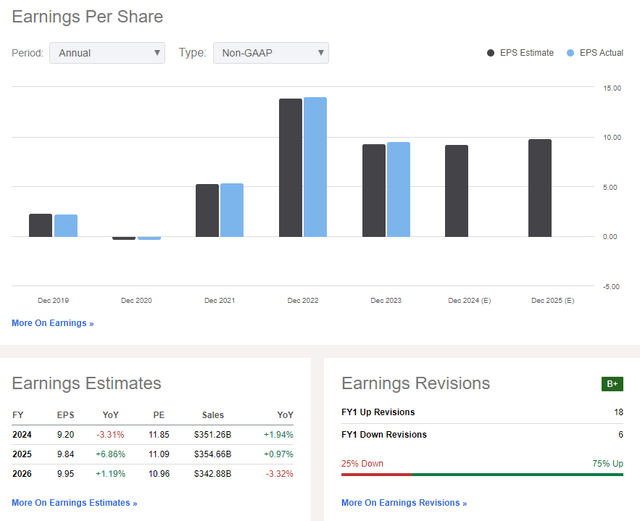
The primary reason for my buy recommendation is XOM’s modest current valuation. Trading just 12.0 times earnings, it’s more than three turns cheaper than its long-term average. If we assume non-GAAP EPS of $9.50 over the next 12 months and apply a conservative 13 multiple given the light growth rate, then shares should trade near $124. While the forward PEG ratio is lofty, XOM’s EV/Sales metrics are compelling.
Also consider that the company’s EV/EBITDA multiple is currently just 5.7x. Stable global oil prices should help the company plan projects and achieve earnings growth, which could result in a reversion to its long-term average EV/EBITDA mean of 7.3x.
XOM: Cheap on Earnings, But Soft Growth Trends. High Dividend Yield.
Seeking Alpha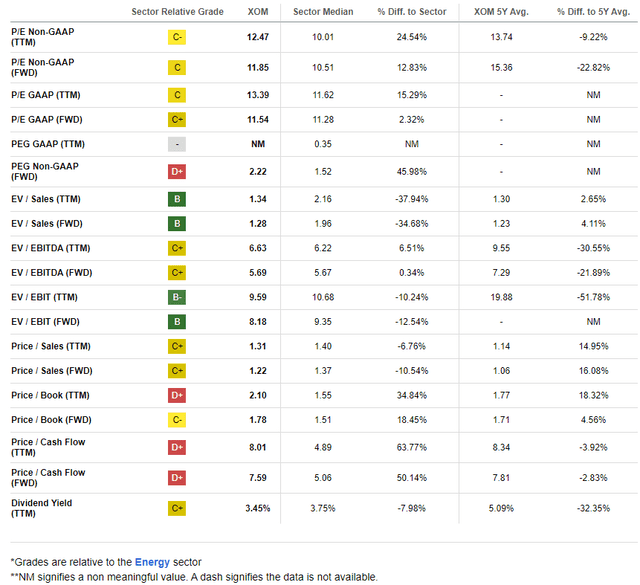
Compared to its peers, XOM features a valuation rating that is not particularly impressive. But profitability trends are very strong, though near-term growth catalysts are few. At the same time, Wall Street analysts have been increasing their collective earnings outlook in the past three months, evidenced by 18 positive EPS revisions compared with just six downgrades. Share-price momentum, which I will detail later in the article, is soft as the summer approaches.
Looking ahead, analysts expect $2.36 of operating EPS to be announced within the July earnings report and the options market has priced in a small 3.1% stock price swing when analyzing the at-the-money straddle expiring soonest after the July 26 report, according to data from Option Research & Technology Services (ORATS).
Competitor Analysis
Seeking Alpha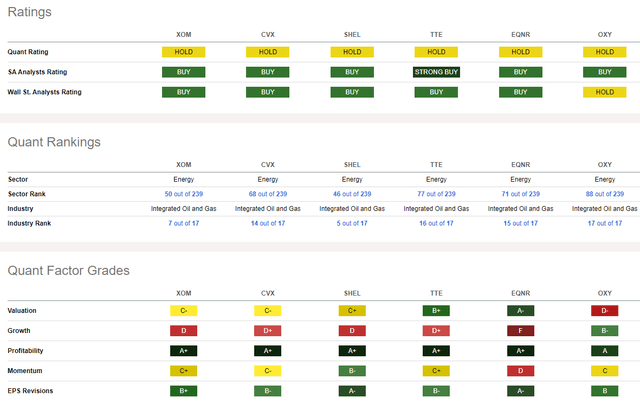
Looking ahead, corporate event data provided by Wall Street Horizon show an unconfirmed Q2 2024 earnings date of Friday, July 26 BMO. Before that, its management team is slated to speak at the Rapid + TCT 2024 conference in Los Angeles from June 25 to 27.
Corporate Event Data Risk Calendar
Wall Street Horizon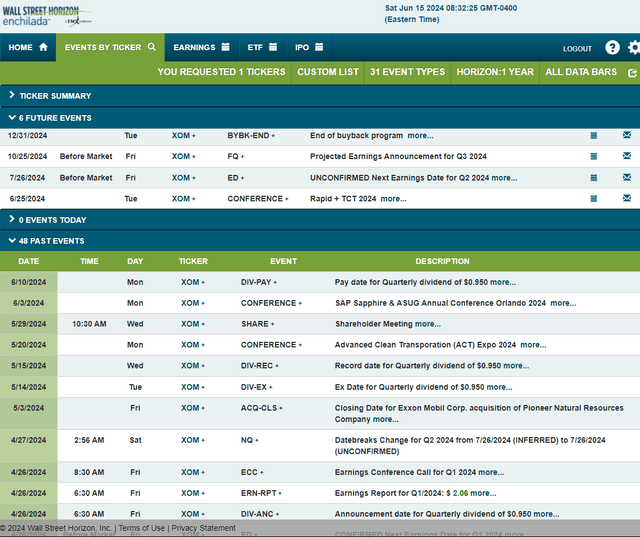
The Technical Take
Following a mixed Q1 report and with a solid valuation case, XOM’s technical chart is challenged when juxtaposed with strength in the overall market. Notice in the graph below that shares turned rangebound in early 2023 after a pronounced uptrend that commenced in late 2020. The mid-$90s to above $120 zone continues to frustrate the bulls and bears alike as XOM’s long-term 200-day moving average is flat in its slope, further evidence of a lack of a primary trend.
The technical story is rather straightforward here. Buying on a drop into the $90s creates a favorable risk/reward play while taking profits as the Energy-sector behemoth nears $120 appears to be prudent. What concerns me from a momentum point of view today is that the overheated rally to $123.75 two months ago has the hallmarks of a bearish false breakout, suggesting that a test of support under $100 could be in the cards.
A breakout above the recent high would, however, trigger an upside measured move price objective to about $150 based on the $25 to $30 height of the current range. So that’s something to look out for in the second half of the year. On the downside, support is near $80 if the $96 support spot is lost.
Overall, XOM is a relatively weak chart, and the ongoing trading range suggests that the bulls and bears will likely continue to battle it out over the near term.
XOM: Shares Churning Between $95 and $120
Stockcharts.com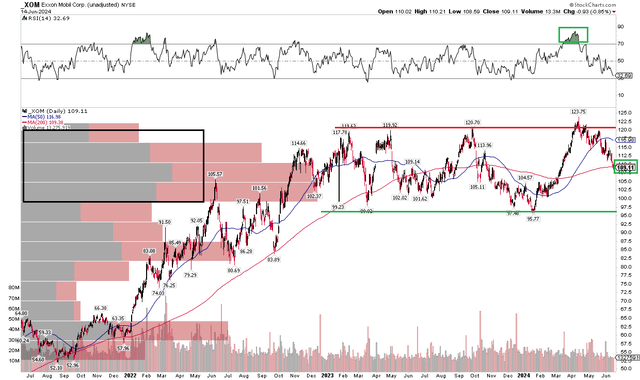
Recommendation Risks
Key risks for my buy recommendation include lower global oil and gas prices and a fall-off in economic strength which could further loosen the supply/demand balance for crude oil, natural gas, and gasoline. Increasing costs could also hurt future earnings growth while the integration of recent acquisitions is a strategic risk for the quarters ahead. Also, a more rapid shift away from fossil fuels for energy generation would likely hurt XOM given its portfolio. Another trend to monitor, this more near term, is falling refining margins given a drop in crack spreads.
The Bottom Line
I have a buy rating on XOM. I see the stock as sufficiently undervalued with a high yield while share buybacks could accelerate in the coming quarters. Amid macro risks of lower energy prices, the stock’s momentum is lackluster at the moment.
Read the full article here


