


 (COST)")


This article presents research on a new “put” indicator. The graph shows the indicator, which is the average number of “puts” purchased each day on the CBOE. Showing the actual number is somewhat new because investors usually see the “puts to calls” ratio but seldom the actual number that goes into the ratio.
Adjusted Daily “Put” Buying on the CBOE (Michael McDonald)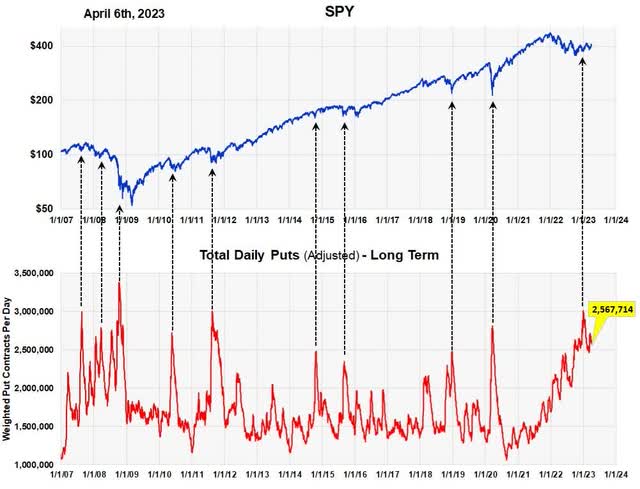

For those who are unfamiliar with options, “put” options are essentially bets that the price of a stock, or stocks, will go lower. High purchase levels mean that large numbers of investors are expecting lower stock prices. History shows it acts in a contrary fashion. When too many investors expect lower prices, they usually go higher. Instead of “talking” about investor sentiment, measuring the amount of “put” buying actually quantifies it.
The graph goes back to 2007 and we’ve indicated with black arrows significant peaks in “put” buying and where they occurred in the market. Peaks almost always occur at significant buying opportunities.
The most recent peak, indicated by the arrow on the far right, occurred at the beginning of January. As you can see from the chart, “put” buying had been building all through 2022 and reached a crescendo in January. The price low on the S&P 500 occurred in October, a few months before the peak.
The really important point is that the level of “put” buying has remained high since the January peak. As the rally’s proceeded there’s only been a slight decline in investor expectations for lower prices. To us, this is a sign of the famous investor, “wall of worry.”
Why is “put” buying in the new indicator “adjusted?”
You may notice that the title in the put chart says “adjusted.” Why is the number of “puts” purchased adjusted? It’s done for two reasons.
The first has to do with growth in markets. If markets are twice as big now as they were 20 years ago, then you can’t compare the number of “puts” purchased today with the number 20 years ago. So, the numbers have to be adjusted to account for the growth in markets.
The second reason for a adjusting the number is more subtle and it has to do with the chart shown below.
Total Puts to Calls Ratio of CBOE (Michael McDonald)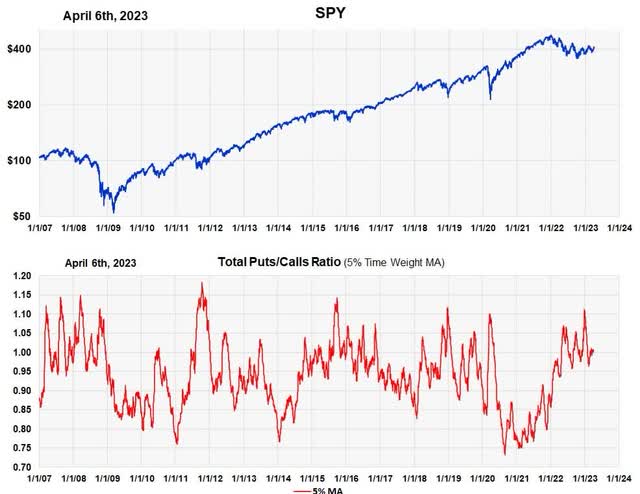

The classic option indicator (shown above) is the “put to calls” ratio, which divides “put” buying by “call” buying. Instead of measuring the actual number of “puts” purchased, you measure it by comparing it against the number of “calls” purchased. The “puts to calls” ratio is what Marty Zweig presented in 1971 when option indicator were first introduced.
Using a ratio gets rid of worrying about the growth factor in markets since you’re comparing apples with apples. Two to one is the same as 2,000 to 1,000; absolute numbers don’t matter.
Historically, the puts to calls ratio has worked very well as an indicator. But it has a drawback. Forming a ratio can often camouflage important messages in the actual numbers. For example, a high “puts to calls” ratio can occur, not because “put” buying is high, but because “call” buying is low, and this isn’t really what you really want.
In truth, you want both; high levels of “put” buying, plus a high “put to call’ ratio. To create an indicator that has both, you simply multiply the two together. You multiply the “puts to calls” ratio by the number of “puts” purchased. This makes “puts” purchased a little bit more important when it occurs with a high ratio. For those mathematically inclined, the indicator is actually plotting, “puts squared divided by calls.”
So, that’s what the new put indicator is. It takes “puts” purchased, adjusts them for the growth in markets, and then “weights” the number by the “puts to calls” ratio. It’s actually a 20-day moving average of this.
Are we in a bear market rally about to end, or a continuation of the bull market that began in October?
This is always a very difficult question. I’ve gone through every bear market since 1974 and there’s no magic solution. Each bear market is unique in its own moment in time.
Market sentiment, like “put” buying, is one factor that can help. A bear market rally usually ends with the with a wide belief the bear market is over. People get convinced that prices are ready to move higher. But they don’t and prices move to new lows. We don’t have that yet. In fact, we have the general belief that the current rally is a bear market rally. Prices have been rising against a wall of doubt and the high level of “put” buying confirms this.
So, unless there is an unexpected event like nuclear use in Ukraine or a global financial crisis, we think the October lows are the lows in the 2022 bear market and we’ve started a move back to at least the all-time highs of 4,800 on the S&P 500.
Read the full article here

 (COST)")
")
")
")

 (NYSE:SNOW)")
")
 Q4 2024 Earnings Call Transcript")
