Investment Thesis
This is a good moment to buy the iShares Core U.S. Aggregate Bond ETF (NYSEARCA:AGG). Its price per share is quoting well below its historical values. Additionally, the Treasury yields have high values, and the Fed is close to achieving its 2% inflation target. When that happens, the Fed will start declining the interest rate, causing an increase in the price per share.
Overview
The United States economy is currently under a high-interest rate environment. In the last Fed meeting, the institution maintained interest rates between 4.25% and 4.50%, the highest level in over 23 years. High-interest rates can represent an opportunity; the key is to select financial instruments that benefit from that scenario.
One way to profit in a high-interest rate environment is to buy fixed-income (bond) instruments and wait until the interest rate declines. However, some fixed-income instruments require a considerable investment, making them unaffordable for small investors.
Another way to profit in a high-interest rate environment is to invest in fixed-income ETFs, allowing an investor to buy a diversified basket of bonds. There are two types of fixed-income instruments: investment-grade bonds and junk bonds; this article will focus on investment-grade bond ETFs, particularly the iShares Core U.S. Aggregate Bond ETF.
The iShares Core U.S. Aggregate Bond ETF is a low-cost financial instrument with exposition to a broad base of investment-grade bonds. Thousands of bonds on multiple sectors of the American economy comprise the ETF.
AGG Is A Low-Risk ETF
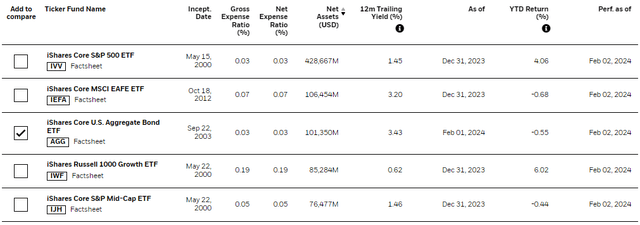
The iShares Core U.S. Aggregate Bond ETF is the third-largest ETF issued by iShares, based on net assets. Its high net assets of $101.350 million reflects its popularity among investors.
Source: iShares
I calculated the volatility of the five instruments mentioned in the previous table from January 15, 2019, to January 15, 2024. I used Python for this purpose. First, I calculated the log returns. Subsequently, I computed the standard deviation of the returns to obtain the daily volatility. Finally, I multiplied the previous value by the square root of 252 to obtain the annual volatility. AGG had a 5.02% annual volatility, the lowest value; iShares Core MSCI EAFE ETF (IEFA) had the second-lowest volatility with 17.02%. Consequently, AGG’s volatility is less than a third of IEFA’s volatility.
The low volatility is because AGG is composed of investment-grade bonds. There are 71.8% AA-rated bonds, 12.1% AA-rated bonds, 12.9% BBB-rated bonds, and not rated 0.3%. The high-quality investment-grade bonds suggest that an investor is more protected from experiencing significant losses in an adverse market scenario.
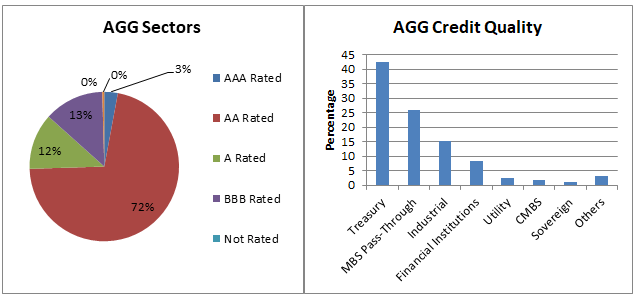
Image was created by the author with data from iShares
The bond composition by sector level is as follows: 42.42% Treasury, 26.02% MBS Pass-Through, 15.19% Industrial, 8.3% Financial Institution, 2.35% Utility, 1.6% CMBS, 0.95% Sovereign, and 3.18% Others.
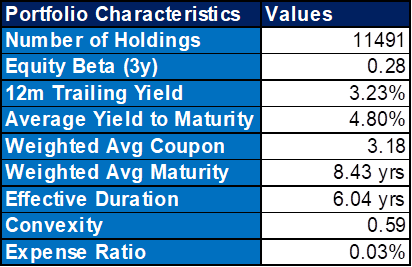
Image was created by the author with data from iShares
AGG is composed of 11,491 financial instruments, and that large number aims to represent a broad spectrum of the American economy. The equity beta at 0.28 indicates a low volatility. The average yield to maturity is higher than the weighted average coupon, revealing that, on average, AGG’s bonds are quoting below their face value. An important measure is the expense ratio, which is 0.03% annually, indicating a low annual maintenance.
Tracking Error
Source: iShares
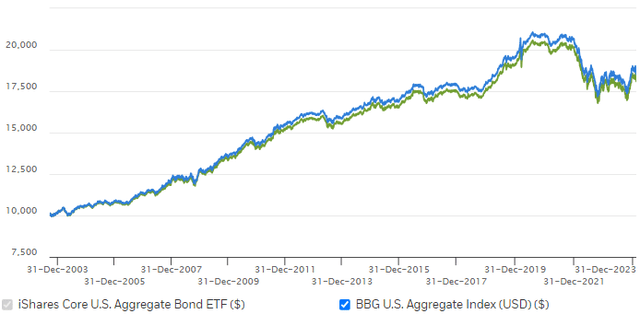
The iShares Core U.S. Aggregate Bond ETF has managed to track the Bloomberg U.S. Aggregate Index. The AGG’s total return in the last ten years was 19.17%, and its benchmark (Bloomberg U.S. Aggregate Index) was 19.64%. However, since September 22, 2003, AGG’s inception day, there has been a divergence; AGG’s total return was 84.99%, while its benchmark was 89.67%.
AGG Price Per Share Evolution
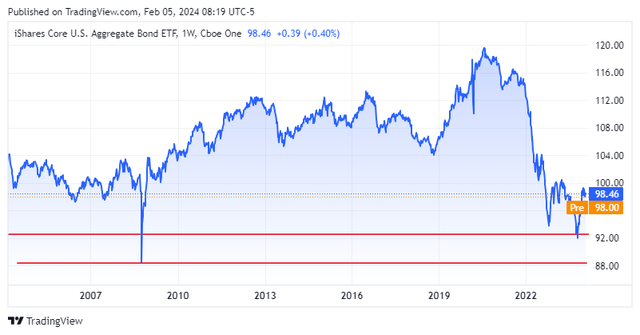
The following image shows the AGG’s historical price evolution from September 29, 2003, to February 4, 2024. A visual analysis shows that the current price is well below its historical levels. Using daily data, I calculated the probability of the price being equal to or lower than $98.46, yielding a value of 7.63%. This value suggests that AGG is trading at a discount.
Source: TradingView
The AGG has seen share prices ranging from $88 to $120 since its inception on September 29, 2003, due to its low volatility, which provides limited opportunities for short-term trading. It’s essential to bear in mind that AGG is a low-volatility instrument designed for risk-averse investors. Based on a visual analysis of the previous chart, the potential profit from buying and selling would be between 7% and 15% over a 1- to 4-year period, plus a yearly coupon between 2% and 3.2%. The current weighted average coupon is 3.18%, but if the interest rates decline, the weighted average coupon will also decline.
Duration
Duration is an essential concept in bond valuation and is worth mentioning in this article. Suppose there is a bond with 8.3 years to maturity and a 4.8% yield. Next, imagine the interest rate declines by 1%, and now the bond issuer can issue a bond with a 3.8% interest rate. In this scenario, the bondholders who bought the fixed-income instrument with a 4.8% yield earn 1% more per year in interest compared to the bond with a 3.8% yield. In 8.43 years, the additional earning is 8.43%. Therefore, the quoting price from the old bond will increase to reflect that extra 1% in earnings.
The other scenario is an increase in the bond yield from 4.8% to 5.8%. In this situation, the old bond is earning 1% less in interest per year than the new bond; thus, the old bond’s price will decline to return a similar yield.
The AGG’s weighted average duration is 8.43 years, and its current average yield is 4.8%. An increase of 1% in AGG’s yield will cause a loss of 8.43% in interest, which will cause a decline of around 8.43% in the AGG price. Meanwhile, a decrease of 1% in AGG’s yield will cause an increase in AGG’s price of around 8.43%.
When the Fed finishes its high-interest rates’ policy, I think it will be possible to see the 5-year and 10-year U.S. government bond yields below 3%. A yield decline of at least 1%.
The Transmission of Monetary Policy: Interest Rate
The Fed has multiple instruments to interfere in the economy, and the interest rate is one of them. The Fed can increase or decrease the federal funds rate. This rate indicates the interest rate at which banks lend to each other.
When the Fed increases the federal funds rate, the banks adjust their commercial interest rates. For people and companies, this means higher interest in their new mortgages. Higher interest rates will decrease credit and consumption. Therefore, fewer consumers buying goods and services will shrink the GDP and reduce inflation.
The Fed uses the mechanism described in the previous paragraph to reduce the inflation level when there is high inflation.
You may wonder how the previous explanation relates to AGG. Consider this scenario: the federal funds rate is 5%, and the 1-year Treasury bill yield is 2%. In this case, a bank would not have incentives to buy Treasury bills and would prefer lending money to other banks, companies, and consumers. Hence, the 1-year Treasury yield would increase to attract investors. Similarly, corporate bonds, municipal bonds, etc., would increase their coupons to remain competitive. Finally, it remains to be said that AGG is a basket of bonds.
Federal Funds Rate and Inflation
The COVID-19 pandemic caused a drastic decline in the American economy. In the second quarter of 2020, the annualized growth of real GDP plunged by 29.9%, while the unemployment rate changed from 3.5% in January 2020 to 14.8% in April 2020. Due to the pandemic, the United States government implemented a series of stimulus in the American economy.
Jerome Powell, the chair of the Federal Reserve, declared in April 2020:
The forceful measures that we as a country are taking to control the spread of the virus have brought much of the economy to an abrupt halt. Many businesses have closed, people have been asked to stay home, and basic social interactions are greatly curtailed (…) The Federal Reserve’s response is guided by our mandate to promote maximum employment and stable prices for the American people, along with our responsibilities to promote the stability of the financial system. We are also committed to using our full range of tools to support the economy in this challenging time. Last month we quickly lowered our policy interest rate to near zero.
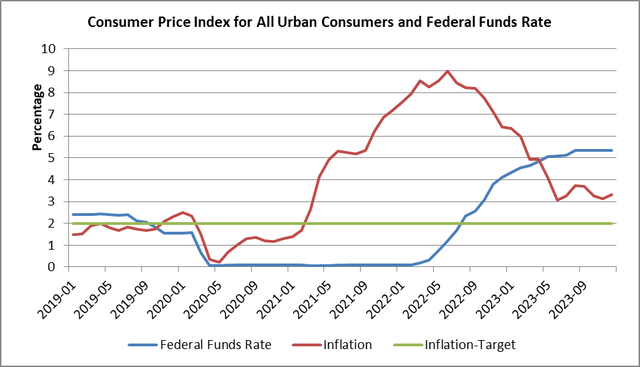
Image was created by the author with data from the Federal Reserve Bank of St. Louis
The series of stimulus generated an increase in inflation, reaching 9% in June 2022. However, in 2022, the economy and the unemployment rate recovered from the pandemic, and the Fed, in March 2022, started to increase the federal funds rate to restore inflation to its 2% objective. The subsequent hikes in the interest rate brought inflation down to 3.23% in December 2022.
AGG, Federal Funds Rate and Yields
This section will visualize the evolution of AGG price, the federal funds rate, 1-year Treasury yield, 2-year Treasury yield, 5-year Treasury yield, and 10-year Treasury yield. The scope is to see how the AGG relates to the Treasury yields instruments and the federal funds rate.
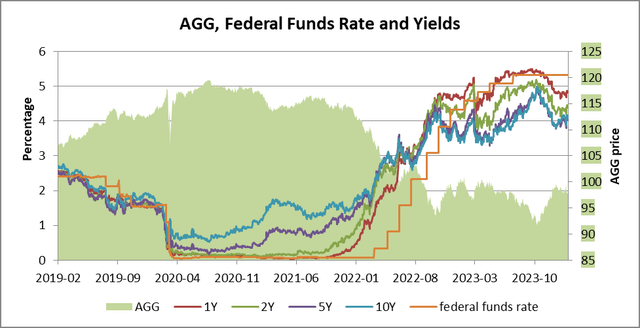
Image was created by the author with data from the Federal Reserve Bank of St. Louis and Yahoo Finance
During February 2019 and July 2020, the AGG ETF gained $12.38 per share, even as the federal funds rate and the government bond yields lost 2.35%; the sharp decline in the federal funds rate in March 2020 was due to the COVID-19 outbreak. This situation aligns with the negative relationship between bond prices and yields. Subsequently, between March 2020 and May 2022, the Fed decided to maintain the federal funds rate below 1%; however, the 2-year, 5-year, and 10-year Treasury yields increased, causing a contango structure. The contango ultimately contributed to a drop in AGG’s price per share. Finally, since August 2023, the Treasury yields have started to decline in anticipation of a possible decline in the federal funds rate.
When the Fed concluded its economic stimulus program in May 2020, it switched its focus to reducing the high inflation rates. The new policy centered on increasing the federal funds rate, aiming to slow economic growth and reduce inflation. Concurrently, the AGG’s price declined from $104 in May 2022 to $97.66 in February 2024.
Correlations
The previous section explained the relationship between U.S. government bonds and AGG ETF. However, it did not support that relationship with data. The following table shows the correlation between the AGG and the federal funds rate with different U.S. government bond yields; it also includes the relationship between the AGG and the federal funds rate.
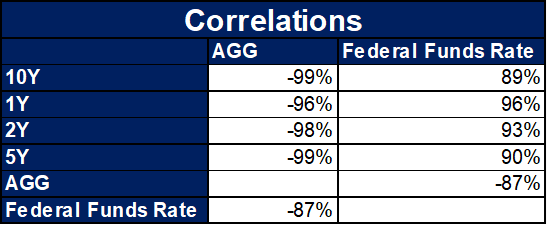
Image was created by the author with data from the Federal Reserve Bank of St. Louis and Yahoo Finance
There is a strong correlation between all the pairwise comparisons. The federal funds rate and the AGG show the weakest correlation, with minus 87%, but it is still high. I want to convey the importance of analyzing the U.S. government yield instruments in a fixed-income ETF.
Conclusion
Based on the analysis presented in this article, I believe that now is a good time to buy AGG. The U.S. economy has high-interest rates, and the expectation is a decrease in the interest rate. That is why AGG’s price per share is well below its historical values.
The Fed’s policy has caused a decline in the inflation rate. As the inflation rate approaches the 2% target, the Fed will initiate a reduction in the federal funds rate. That will cause a decline in bond prices; the same will happen to any fixed-income ETF instrument, like AGG.
Read the full article here


