


Introduction
As the title of this article suggests, I’m lowering my buy price for USB stock. In order to add some context to my reasoning, I am going to start this article by briefly reviewing my history with U.S. Bancorp (NYSE:USB) stock, and then I’ll explain the thinking behind my lowered buy price.
I first bought USB stock a little after the March 2020 crash on 5/13/20, and I wrote about that purchase a couple of months later in my article “Stocks I Bought On The Dip: U.S. Bancorp”. I held that USB position until 12/20/21 at which point I took profits. I wrote about that sale a few weeks later in my article “Why I Recently Took Profits In U.S. Bancorp”. Overall, this investment worked out well for me.
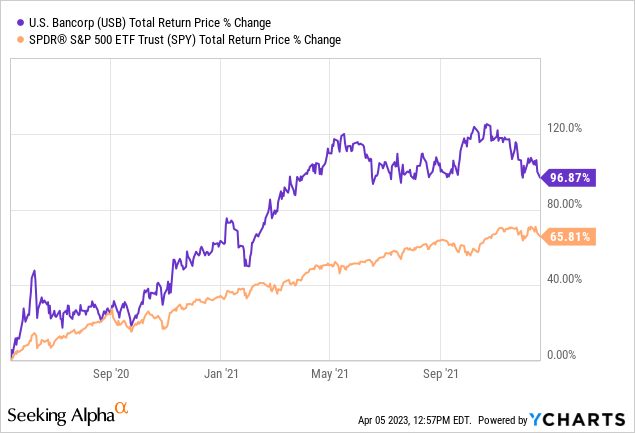

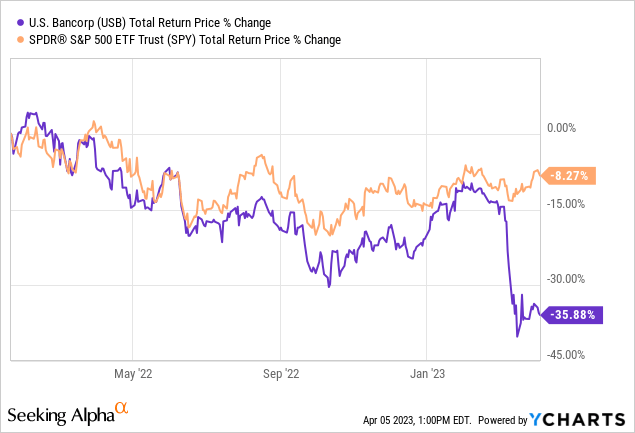
The investment was basically a double for me and significantly outperformed the S&P 500 if held over the same time period. Additionally, since the sell article was published, the stock has not performed well:
I don’t always buy stocks so close to their bottoms and sell them so close to their tops, but in this case the strategy worked out as expected. I gave full explanations of that strategy in my original articles, but here is the conclusion from my “sell” article.
I base when to sell cyclical stocks on where I think we are in the economic cycle and what the market has been willing to pay for the stock during previous cyclical peaks. Often this means I sell cyclical stocks before they reach their new peaks, and I’m okay with that. With cyclicals, the downside is much riskier than the upside potential the later we get in the cycle.
Just as I was finishing writing this article, USB’s earnings came out and SA has breaking news the stock price is down -7%. So, now it’s basically back down to the price where I took profits. I have no idea whether the price will stay there, or reverse and go on to make new highs. But I do know that the downside risk is higher than the upside reward over the next 1-3 years.
The strategy I use for deeply cyclical stocks isn’t meant to have a lot of precision. It’s actually designed to take advantage of the fact that you don’t need to have a lot of precision in order to do well with deeply cyclical businesses because they are typically very volatile. So, usually, if I am aiming for a 100% return, and I get it, then I take profits even if the stock might eventually peak at a much higher level. I do this because the downside moves can be swift and deep, and their precise timing difficult to know.
After the stock price had fallen along with the rest of the market, but before the banking crisis, I published another article on July 17th of last year titled “I Only Buy The Best Banks During Recessions. Here Is The Price I Would Buy U.S. Bancorp”. Here is what I had to say in that article regarding when to buy the stock.
Given USB’s long history of recovering in a timely manner from downturns and producing both good absolute and good relative returns, and, going into this recession it was similarly valued compared to the last recession, and that buying the stock at -50% off its highs both had a reasonable chance of occurring during a recession, I plan to take an approximate 1% portfolio weighted position in the stock if the price falls below my ‘buy price’ of $31.79 (which is about -50% off its highs).
Recently, the stock price bottomed at $32.72, just above my buy price, and right now the stock is trading at about $35 per share. So, it just missed my former buy price and the stock is sitting just above that level as I type. This recent stabilization gave me a chance to think about the current situation, and decide if I wanted to make any changes to my buy price given the information we have now, and ultimately I decided to lower my buy price. Since I announced my old buy price publicly, I feel like I have a responsibility to share my changes and the thinking behind them in a public update article, which is what I will do today.
The Basics
If you would like to understand my full process for investing in stocks like USB, please read the last article I published and linked to where I go into detail about the entire process. In this article, I will share the basics behind the process, and the relevant changes that led me to lower my buy price.
The first important thing to understand about my approach to USB is that I classify USB as a “High Quality” and “Deeply Cyclical” stock.
FAST Graphs
The reason I categorized USB as a “deep cyclical” is because historically they have experienced earnings growth declines deeper than -50% during recessions. The reason I categorize it as “high quality” is because historically it has always had both earnings and the stock price fully recover from those drawdowns in a timely manner. These categories are important because it means that earnings and fundamental metrics are usually not the best way to value the stock because they can fluctuate a lot, yet, the stock is still investable because these declines have always been temporary.
Because earnings aren’t the best way to value deep cyclical stocks, I use historical price cycles as a guide. So, below I have shared a table that contains USB’s historical down cycles over the past 35 years.
| Year | ~Time Until Bottom | ~Duration | ~Depth |
| 1989 | 15 months | 2 years | -45% |
| 1999 | 15 months | 5 years | -62% |
| 2008 | 6 months | 4 years | -76% |
| 2020 | 3 months | 1 year | -52% |
| 2023 | ? | ? | -43% (so far) |
The typical deep cyclical stock I buy with this strategy I purchase at about -50% off its highs. I aim for it to return to new highs within 5 years, and I make about a 100% return if all goes as planned. USB in 2020 was exactly that sort of typical stock. I bought it about -50% off its highs and it basically doubled, at which point I took profits. But when I bought USB in May of 2020, several things were different than they are now. First, even though I didn’t know it at the time and I expected a double dip in the economy, the market had already bottomed in March 2020 and we were in a recession. I also had somewhere around 50% cash remaining to invest that I had raised in February before the market crashed. Having so much cash, I could afford at the time to buy USB at higher price than it had fallen to during the previous two recessions. Additionally, it was pretty clear by mid-May both the Fed and the government were going to support the economy and banks. Because of all these factors, and that I knew USB was a very high quality bank, I didn’t demand a lower price at the time and went ahead and bought.
But, if we look at USB’s historical recession drawdowns that started in 1999 and 2008, we see that 1999’s drawdown was deeper than -60% and 2008’s was deeper than -75%. (And just as side note here, if you buy a stock that’s -50% off its highs, and it goes on to fall -75%, you don’t suffer a -25% drawdown, you suffer a -50% drawdown even though you bought after a -50% decline. Imagine buying a stock that peaked $100 at $50. If it falls -75% off its highs, that’s $25, which is half of $50.) So, there can be a considerable amount of suffering still to come even if an investor bought at a pretty good price. And, equally as important, an investor is leaving significant amounts of money on the table in this situation as well. A stock that is purchased after a -50% drawdown and recovers produces a +100% return. A stock that is purchased after a -75% drawdown and recovers produces a +300% return. So there are benefits, both in avoiding the drawdown, but also in the future returns, if one can get a lower price.
The Current Situation
My last USB article, where I shared my buy price, was written well before the banking crisis. The simple fact is that things are different now. Banks, and their agent the Federal Reserve, have a difficult task ahead of them if they want to produce the levels of earnings that were priced into their stocks before the bank crisis. Low interest rates combined with government stimulus meant that fewer people needed to be in a perpetual state of indebteness, which is what banks ultimately need in order to make money. They need people and businesses to need loans, and they also need those borrowers to pay the bank back on time with interest. In addition to this, if interest rates are fixed, as they often are, banks need to ensure that inflation does not exceed the interest rate during the loan term, otherwise banks ultimately lose money in real terms and that is not a sustainable business model. This is fine line that banks require in order to make money. The Fed’s job is ultimately to try ensure this goldilocks environment for banks. The Fed uses unemployment as a proxy for borrowers being able to repay and not default (because it’s hard to pay back a loan if you don’t have a job), and it uses negative inflation language because it’s negative for banks’ real returns. It uses “financial stability” as a proxy for any other sort problem banks might have (like runs on the bank, or any other trouble banks get themselves into). At any rate, it’s important to understand that the Fed’s main job is to protect the long-term profits of the banking system. So, it’s willing to cut off a couple of fingers like SVB and Signature in order to save the rest of the banking system. And that’s what they did during the crisis. The Fed also doesn’t care about the stock market or whether there is a recession. Recessions can sometimes be good for banks if it means more people need to borrow money, they just can’t be so bad that people can pay the money back.
I want to make my views on this clear because the big question a potential USB investor needs to answer is whether we are likely to have a recession at least as bad as 2002 within the next year or two. I think the answer to that is “yes” we are, and the Fed is going to cause most of it. If we take the three things the Fed needs to balance in order for banks to be profitable, we have limiting defaults, limiting inflation, and preventing a bank panic. The Fed, along with the FDIC, have already prevented a bank panic by ensuring the deposits of failed banks and lending to troubled banks. But because of demographics, deglobalization, pandemic stimulus and low interest rates for a very long time, services inflation is likely to very sticky even if goods inflation is transitory. Defaults are not currently a problem. Therefore I think the Fed is going to focus on the problem at hand, keeping rates high until there is a recession so inflation comes down. The Fed only cares about a recession if it is bad enough to cause excessive loan defaults because inflation is costing banks now and is certain, while a recession and defaults are not here now and are uncertain.
There is a chance that the Fed manages a “soft landing” and finds a goldilocks level in which inflation comes down and higher interest rates don’t cause a recession. I put the odds on that occurring at about 20%, with some sort of recession at 80%. I expect banks to sell off as they have during past recessions if we have another one, so it makes sense to lower USB’s buy price to reflect that.
Conclusion
Since I think a recession is probably coming, when I look back at USB’s drawdown history, during the last two pre-pandemic recessions, the stock price fell more than -60% both times. For that reason my new buy price is about -60% off USB’s high price, or about $25.43 per share. If we are able to buy the stock at that price and it eventually recovers its old highs, it would produce a +150% return. With that sort of potential gain, we could wait many years for a recovery and still produce above market average returns.
Read the full article here


: Making Incremental Cost Improvements In A Flat Revenue Environment")
 Q4 2024 Earnings Call Transcript")
")
")
")
")
