This article series aims at evaluating ETFs (exchange-traded funds) regarding the relative past performance of their strategies and metrics of their current portfolios. Reviews with updated data are posted when necessary.
RDVI strategy
FT Cboe Vest Rising Dividend Achievers Target Income ETF (BATS:RDVI) is an actively managed fund launched on 10/19/2022. It has a portfolio of 50 stocks, a 12-month distribution rate of 8.51%, a 30-day SEC yield of 1.33% and an expense ratio of 0.75%. Distributions are paid monthly.
RDVI “seeks to provide investors with current income with a secondary objective of providing capital appreciation.” It invests in the same underlying index as First Trust Rising Dividend Achievers ETF (RDVY), and sells call options to enhance distributions. As described by First Trust,
the Fund will pursue its investment objective by investing primarily in U.S. exchange-traded equity securities contained in the NASDAQ US Rising Dividend Achievers™ Index and by utilizing an “option strategy” consisting of writing (selling) U.S. exchange-traded call options on the S&P 500® Index or exchange-traded funds that track the S&P 500® Index.
To be eligible in the NASDAQ US Rising Dividend Achievers Index, companies must:
- be in the top 1,000 market capitalizations of the NASDAQ US Benchmark Index with an average daily trading volume over $5 million,
- not be classified as REIT,
- have paid a dividend in the trailing 12-month period greater than the dividend paid in the trailing 12-month period three and five years prior,
- have EPS in the most recent fiscal year greater than in the 3 prior fiscal years,
- have a cash-to-debt ratio above 50%,
- have a trailing 12-month payout ratio below 65%.
Companies passing these criteria are ranked by a factor combining dividend increase over the previous five years, current dividend yield, and payout ratio. The 50 best-ranked companies are included in equal weight. If exposure to a sector is over 30%, the lowest ranked company in that sector is replaced with the next highest-ranked company from another sector. The index is reconstituted annually and rebalanced quarterly.
RDVI portfolio
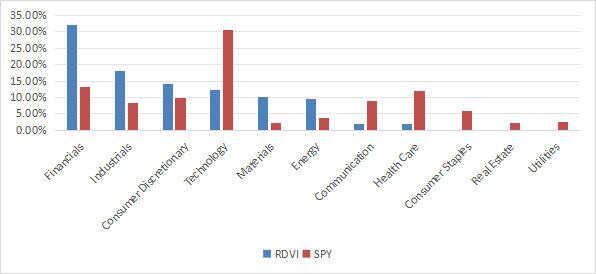
Besides the 50 constituents of the underlying index, RDVI currently holds a short call option position expiring on 8/2/2024 with a strike price of SPX 5,460. The heaviest sector is financials with 32% of asset value, followed by industrials (18%). Consumer discretionary, technology, materials, and energy weigh between 10% and 14%. Compared to the broad index S&P 500, represented in the chart below by SPDR S&P 500 ETF Trust (SPY), RDVI massively overweights financials, industrials, materials, and energy. It underweights technology, communication, healthcare and ignores consumer staples, real estate and utilities.
Sector breakdown (Chart: author; data: First Trust, SSGA)
Positions are rebalanced in equal weight on a quarterly basis, but they may drift with price action. As of writing, the top 10 holdings, listed in the next table with fundamental metrics, represent 22.7% of asset value. These are the constituents with the highest price momentum since the last rebalancing. The heaviest one weighs 2.38%, so the portfolio is well-diversified and risks related to individual companies are low.
|
Ticker |
Name |
Weight |
EPS growth %TTM |
P/E TTM |
P/E fwd |
Yield% |
|
DHI |
D.R. Horton, Inc. |
2.38% |
5.88 |
12.12 |
12.36 |
0.67 |
|
MLI |
Mueller Industries, Inc. |
2.37% |
-15.23 |
14.56 |
14.07 |
1.14 |
|
EWBC |
East West Bancorp, Inc. |
2.31% |
-12.48 |
11.30 |
10.75 |
2.49 |
|
JXN |
Jackson Financial, Inc. |
2.27% |
66.96 |
2.31 |
5.01 |
3.19 |
|
RDN |
Radian Group Inc. |
2.26% |
-13.07 |
9.85 |
10.20 |
2.64 |
|
RF |
Regions Financial Corp. |
2.26% |
-24.15 |
12.77 |
11.45 |
4.40 |
|
LEN |
Lennar Corp. |
2.24% |
0.37 |
12.27 |
12.61 |
1.11 |
|
MTB |
M&T Bank Corp. |
2.21% |
-20.21 |
12.88 |
12.26 |
3.11 |
|
FITB |
Fifth Third Bancorp |
2.20% |
-10.82 |
13.51 |
13.00 |
3.31 |
|
ODFL |
Old Dominion Freight Line, Inc. |
2.20% |
1.39 |
35.15 |
35.76 |
0.51 |
Fundamentals
RDVI looks much cheaper than the S&P 500 regarding valuation metrics, as reported in the next table. Nevertheless, these numbers are biased by the weight of financials: valuation ratios are lower and less reliable in this sector. More interestingly, RDVI also has significantly better earnings growth and cash flow growth rates.
|
RDVI |
SPY |
|
|
Price/earnings TTM |
11.74 |
26.53 |
|
Price/book |
2.23 |
4.63 |
|
Price/sales |
2.16 |
3.02 |
|
Price/cash flow |
11.68 |
18.13 |
|
Earnings Growth |
31.28% |
23.24% |
|
Sales Growth |
8.00% |
8.80% |
|
Cash Flow Growth |
14.85% |
8.94% |
Data: Fidelity.
In my ETF reviews, risky stocks are companies with at least 2 red flags among: bad Piotroski score, negative ROA, unsustainable payout ratio, bad or dubious Altman Z-score, excluding financials and real estate where these metrics are unreliable. Here, there are no risky stocks in the portfolio, which is an excellent point. However, 32% of asset value is in financials, and consequently is excluded from this evaluation. According to my calculation of aggregate metrics reported in the next table, quality is superior to the benchmark: the average Piotroski F-score is marginally lower, but the return on assets is significantly higher.
|
RDVI |
SPY |
|
|
Atman Z-score |
4.85 |
3.79 |
|
Piotroski F-score |
5.53 |
5.97 |
|
ROA % TTM |
10.18 |
7.31 |
Historical performance
The next chart plots total returns since inception of RDVI, RDVY (tracking the same index without options) and SPY. RDVI is close behind RDVY and both have lagged the broad benchmark. Nonetheless, RDVI track record is too short to assess the potential of the strategy in a bear market and a full market cycle.
RDVI vs RDVY, SPY (Seeking Alpha)
Competitors
The next table compares characteristics of RDVI and five ETFs implementing buy-write strategies in the S&P 500 universe (holding stocks and selling call options for income):
- First Trust BuyWrite Income ETF (FTHI)
- Global X S&P 500 Covered Call ETF (XYLD)
- Invesco S&P 500 BuyWrite ETF (PBP)
- JPMorgan Equity Premium Income ETF (JEPI)
- Global X S&P 500 Covered Call & Growth ETF (XYLG).
|
RDVI |
FTHI |
XYLD |
PBP |
JEPI |
XYLG |
|
|
Inception |
10/19/2022 |
1/6/2014 |
6/21/2013 |
12/20/2007 |
5/20/2020 |
9/18/2020 |
|
Expense Ratio |
0.75% |
0.75% |
0.60% |
0.29% |
0.35% |
0.35% |
|
AUM |
$1.21B |
$784.23M |
$2.87B |
$91.79M |
$34.03B |
$60.53M |
|
Avg Daily Volume |
$7.07M |
$5.44M |
$15.20M |
$466.14K |
$158.97M |
$193.05K |
|
Holdings |
51 |
188 |
505 |
506 |
137 |
505 |
|
Assets in Top 10 |
22.70% |
31.30% |
34.41% |
34.49% |
15.26% |
34.30% |
|
Turnover |
86.00% |
98.00% |
7.90% |
12.00% |
190.00% |
5.25% |
|
Yield TTM |
8.51% |
8.57% |
9.47% |
16.29% |
7.24% |
4.42% |
RDVI has the highest fee (tie with FTHI) and is the third-largest fund in this group. Regarding total return since inception, RDVI is the best performer, but it is also more volatile and shows deeper draw-downs than its peers.
RDVI vs competitors since inception (Seeking Alpha)
Takeaway
FT Cboe Vest Rising Dividend Achievers Target Income ETF holds 50 dividend-growth stocks and sells S&P 500 call options for income. RDVI is well-diversified across holdings thanks to an equal-weight methodology, but it is overweight in financials. Valuation, growth and quality metrics look attractive compared to the S&P 500. The RDVI track record is short, but promising in its category: it has outperformed other ETFs implementing a buy-write strategy with S&P 500 options. Nonetheless, it shows a larger downside risk.
Read the full article here


