Investment update
Following my last update on Safran (OTCPK:SAFRF) the stock is +15% excluding $2.37 dividends per share. In that note, titled “Industry Tailwinds Shifting Capital Productivity, FCF Higher, Rallying On Fundamentals”, I outlined several factors behind the buy thesis:
- Attractive European play for global aerospace and defense industry positioning.
- Industry tailwinds – 1) US + world defense budget projections, 2) global military expenditure trends, 3) negative working capital from its current order book,
- Exceptional economics with recently higher turnover and at the margin, driving FCF for redistribution and growth of future earnings.
- Extensive reinvestment runway to redeploy such funds at an advantage (characterized as business returns >12%, the LT market averages).
The company’s most recent developments are noted and updates to my modelling corroborate a reiterated buy.
Figure 1.
TradingView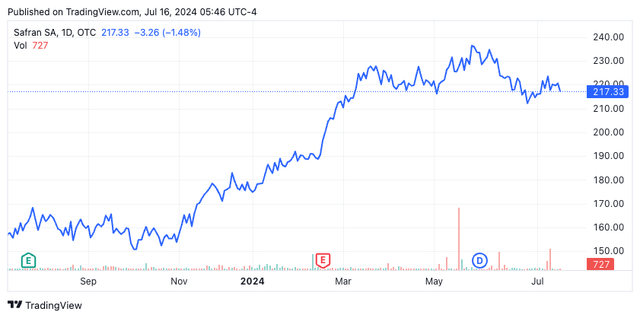
Investment Thesis
Headquartered in Paris, France, SAFRF operates through three primary segments: (i) Aerospace Propulsion, (ii) Aircraft Equipment, Defense and Aerosystems, and (iii) Aircraft Interiors. SAFRF is a key European player in the global aerospace and defense industry, providing propulsion systems, landing gears, avionics, aircraft seats, and cabin interiors for both civil and military aircraft. This extends to maintenance, repair, and overhaul (“MRO”) services, and, it is heavily involved in producing spare parts for various aircraft systems.
I remain buy on SAFRF due to 1) numerous compelling catalysts [US defense budget pull-through, fundamental momentum, earnings ramp, reinvestment runway, management throwing off ~$2Bn in FCF every 12mo], 2) economic characteristics [~20% ROICs, post-tax earnings are ~2x since FY’21 of very little capital growth], and 3) valuations supportive to ~$306/share by FY’26E in my upside case (11.8% CAGR), baking in ~7% sales growth p.a.
Notably, the debate hinges on SAFRF producing >7% annualized sales growth to FY’26 – this is my base, whereas consensus projects ~14%. Thus, the market may be underappreciating the durability of SAFRF’s competitive advantages in my view. Net-net, reiterate buy.
Compelling catalysts
Three main catalysts could drive the stock beyond $300/share by FY’26E in my opinion: 1) US + global defense spending, 2) Civil aftermarket growth, and 3) momentum in its helicopter and military engine sales.
Defense budget:
- The Department of Defense (DoD)’s proposed defense budget for FY’25 includes an allocation of ~$850Bn (+100bps on FY’24). This increase is consistent with the funding levels approved in the Fiscal Responsibility Act of 2023. Part of this allows the DoD to carry up to 50% of its maintenance CapEx forward from year to year as a rollover. This will accumulate even more funds in my view. Based on its Q1 numbers, it had ~50% ex-EU exposure with ~$13Bn of USD hedges in place. SAFRF’s revenues were up across the board in Q1 with propulsion +15%, OE +10% and widebody engines +50%. Its narrowbody air traffic is now >113% of FY’19 levels as further evidence of the impulse of the spending. Since FY’21, EBITA is +$1.3Bn with ~$9Bn in new sales (Figure 2) which has methodically rotated FCF and earnings on capital running the business (Figure 3).
Civil aftermarket growth:
- Q1 civil aftermarket sales were +27.3% YoY underscored by long-term service agreements for CFM56 and LEAP engines (“LEAPs”). Critically, LEAP deliveries were “flattish” YoY at 367 units per management, such that management tightened FY’24 forecasts back to 10-15% YoY [vs. 20-25% previous]. This implies ~150-200 deliveries for remainder of the year. Notably, American Airlines signed a service agreement covering >400 LEAP-1B engines, while the Chinese aircraft leasing company, CALC, placed an order for 40 LEAP-1A engines.
New/renewed contracts for helicopter and military engines:
The visibility of SAFRF’s pipeline high, with the following orders/renewals from Q1 FY’24:
- ADAC Heliservice (50 Arriel 2E engines)
- The U.K. Ministry of Defense renewed its agreement for RTM322 engines for the Royal Navy’s fleet of Merlin helicopters for 6yrs.
- The U.S. Coast Guard (240 Arriel engines).
- Bristow Group (Arrius 2B2 engines and signed a support-by-the-hour contract for its new H135 fleet)
- Qatar Armed Forces (support for M88 engines for their fleet of 36 Rafale aircraft).
Figure 2.
Company filings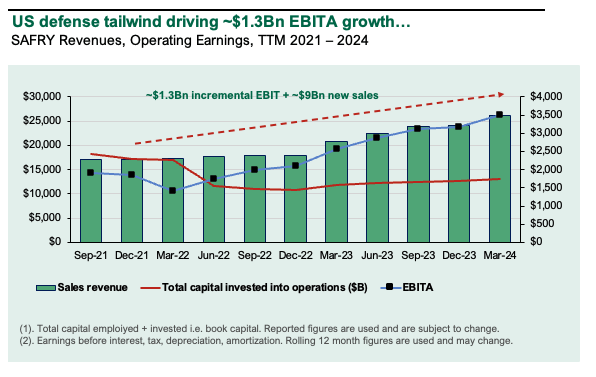
Figure 3.
Company filings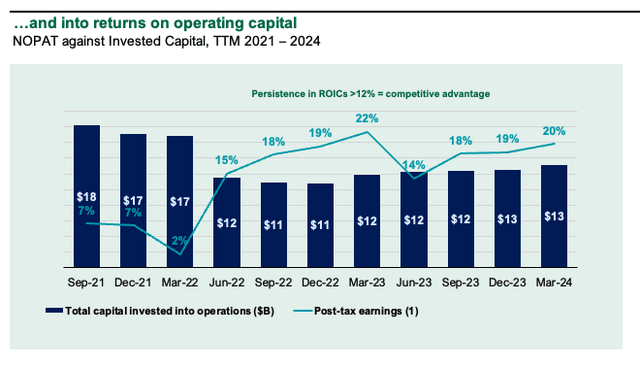
Attractively valued if sales growth ≥7%
My view is the valuation debate hinges on sales growth saying >7% to translate earnings + FCF to higher valuations. ROICs are ~1,400bps since FY’21 driven by 1) +250bps post-tax margin and 2) capital turns increasing from ~1x to ~2x in this period (Figure 4). It is now throwing off ~$1Bn in sales every 12 months. SAFRF’s earnings are increasing with each $1 of capital thrown into the business such that (a) investors value it at 7.1x EV/IC vs. ~3x in ’21, and (b) each $1 of NOPAT is valued at ~35x vs. ~26x in ’21 (Figure 5).
Figure 4.
Company Filings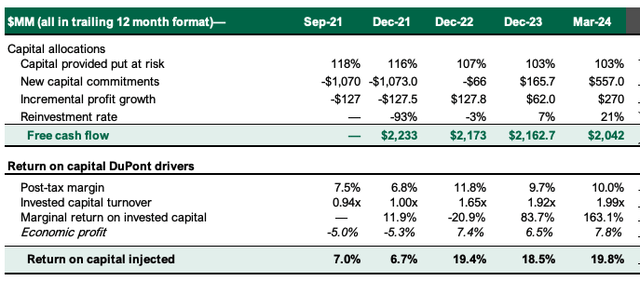
Figure 5.
Company filings, author
Valuation insights
- Excess returns – defined as all ROICs > hurdle rate of 12% – have increased back to ~8% (Figure 6), justifying higher for longer multiples: My take on this is the company’s competitive advantage period (the durability of this >12% spread remaining in situ) is ~8yrs. My numbers [see: Appendix 1 for base case] therefore project its ROICs to fade to the 12% hurdle rate at ~12% per year.
- The excess spread (economic profits, or EPs) has worked its way into SAFRF’s valuations (Figure 7) and the question is what amount of sales growth is not baked in – Persistence in returns is one competitive advantage SAFRF possess and my view is 1) sales growth >7% supports sustained EPs of ~8% of more, and 2) the sustained EPs support a floor of ~32x NOPAT moving forward.
Figure 6.
Company filings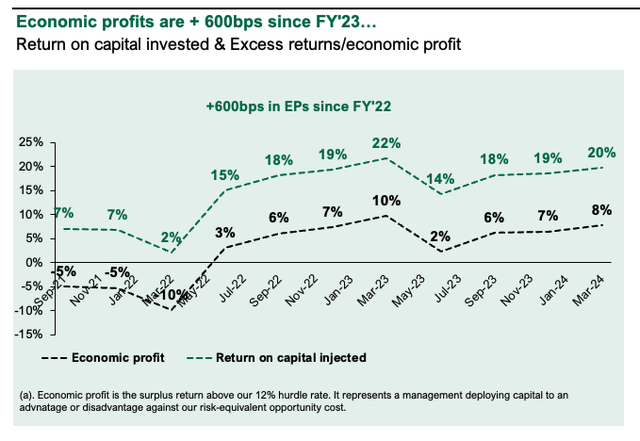
Figure 7.
Company filings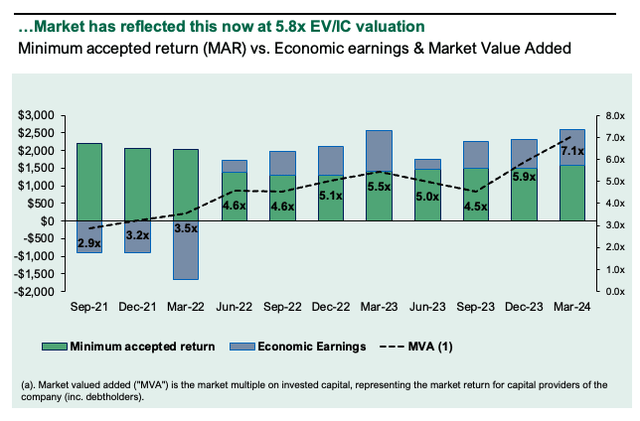
- With ~7% sales growth in the base with the assumptions above [see also: Appendix 1, Appendix 2 for drivers] implies ~$306/share by FY’26E, or ~11-12% CAGR. The stock is worth ~$223/share today in my view and could trade at ~30x NOPAT with no change in EV/IC multiples. Whilst I am acutely aware of the reduction in LEAP projections for FY’24, on the upside, sales growth is the key lever -and ~7% annualized is highly conservative with consensus eyeing 14% avg. to FY’26E – they too note the LEAP hurdles at these projections (Figure 8). On the downside, we are using a contracted 32x multiple, but if sales growth avg. ~400bps instead this derives ~$242/share by FY’26E (~3.3% CAGR) and suggests the stock is about worth what we pay for it today (Figure 9).
Figure 8.
Author’s estimates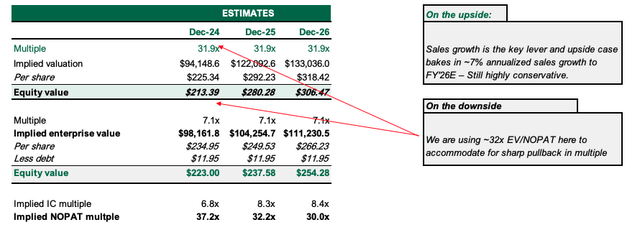
Figure 9.
Author’s estimates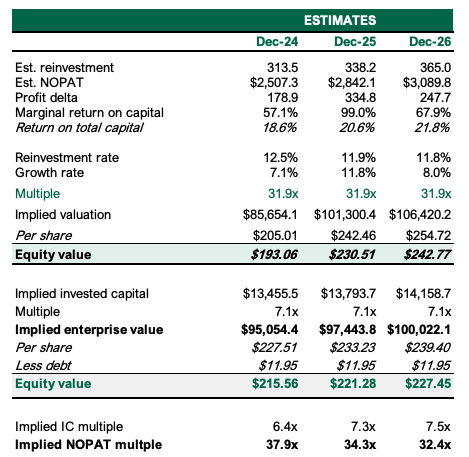
Risks to investment thesis
Downside risks to the thesis include 1) <5% sales growth which hampers the valuation upside and warrants multiples contraction, 2) unforeseen challenge to global defense spending, 3) rotation out of industrials inc. aerospace + defense, and 4) the broader set of macro risks that must be factored in as we speak, mostly the thread of further negative inflationary data.
Investors must realize these risks in full before proceeding any further.
In short
SAFRF presents with compelling catalysts that support continued valuation upside to FY’26E. Critically, my views are (i) that my ~7% estimated three-year avg. sales growth is highly conservative, yet (ii) this still sports ~11-12% CAGR in market value at 32x NOPAT (~9% contraction from the time of publication) to ~$306/share, and (iii) that it is worth ~$223/share today. The valuation calculus remains skewed in our favour based on these provable facts. Net-net, reiterate buy.
Appendix 1.
Author’s estimates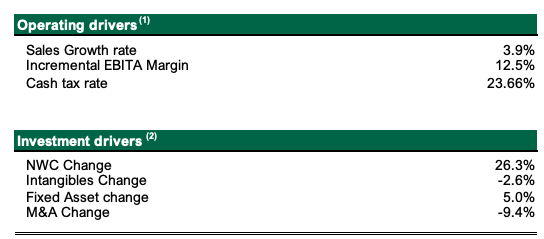
Appendix 2.
Author’s estimates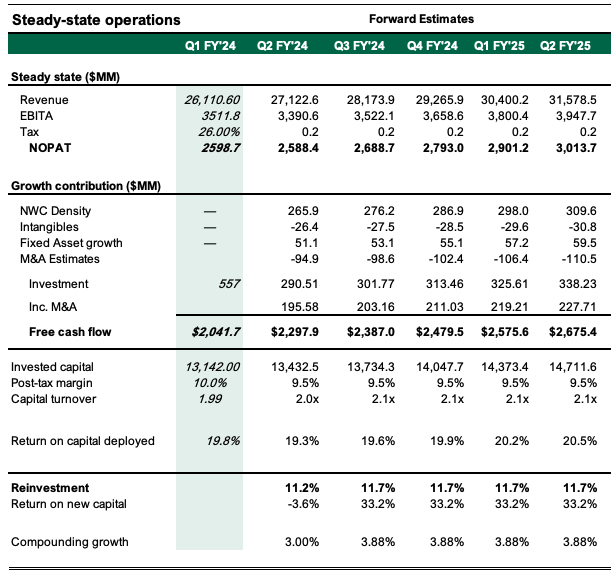
Editor’s Note: This article discusses one or more securities that do not trade on a major U.S. exchange. Please be aware of the risks associated with these stocks.
Read the full article here


