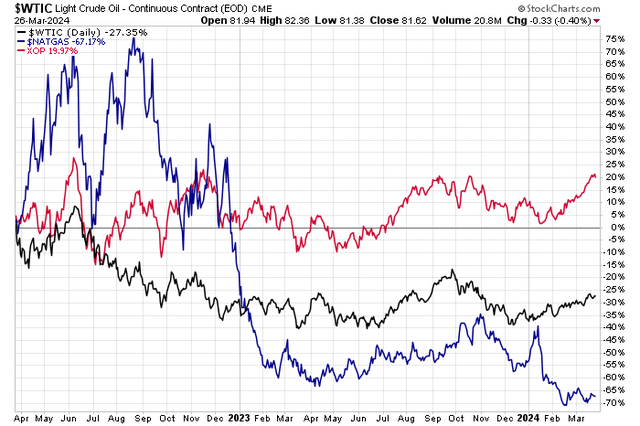
It has been a wild couple of years in the oil & gas exploration and production space. The SPDR S&P Oil & Gas Exploration & Production ETF (XOP) has returned 20% since March 2022. Recall that it was 24 months ago when global oil and natural gas prices were shooting higher following Russia’s invasion of Ukraine. While shares of E&P firms were volatile in the months thereafter, XOP has steadied while both WTI and Henry Hub are firmly in the red.
I reiterate a buy rating on Schlumberger Limited (NYSE:SLB). While the stock has been down modestly since I initiated coverage last year, I expect its technological advances and exposure to global growth to be key tailwinds.
Oil & Gas Down Last 2 Years, Energy E&P Stocks Up
Stockcharts.com
According to Bank of America Global Research, SLB is the world’s largest provider of services and equipment used in the drilling, evaluation, completion, production, and maintenance of oil and natural gas wells. Revenues in 2023 totaled $33.1bn and Adjusted EBITDA was $8.1bn.
The $77 billion (market cap) Energy-sector stalwart posted a healthy earnings beat in its Q4 2024 report back in January. Non-GAAP EPS of $0.86 topped estimates by $0.03 while 14% year-on-year revenue growth was also fractionally better than expected. Its EPS and free cash flow trajectories appear solid, backed by robust international and offshore operations. The quarter also featured healthy operating margins with $2.28 billion in free cash flow.
What’s more, the management team repurchased $100 million worth of shares and hiked its dividend by 10%. It came as oil was rangebound and natural gas prices fell. Today, with WTI above $80 and Brent around $85, the fundamentals are arguably more attractive despite weakness in the gas market.
SLB’s long-term investments in the Middle East offer more growth opportunities, though geopolitical risks are apparent. But there’s geographic diversification with SLB’s assets in Brazil, West Africa, and Southeast Asia. The firm is known for its industry-leading tech-focused portfolio that may be able to weather traditional oil market volatility better than its peers.
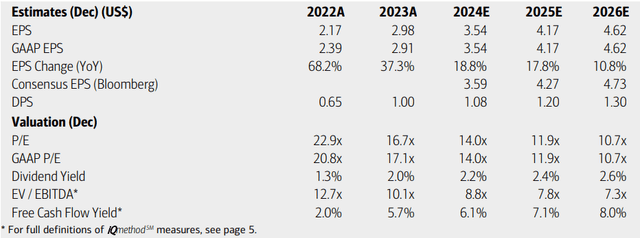
On valuation, analysts at BofA see earnings jumping close to 20% in 2024 with continued growth in the out year. By 2026, operating EPS may approach $5 while sales growth eases from 13% this year (estimated, per Seeking Alpha’s consensus data) to the mid-single-digit range by 2026.
Dividends, meanwhile, are expected to continue to increase as shareholder-friendly activities persist. With a mid-teens earnings multiple and a low EV/EBITDA ratio, the stock remains a bargain in my view while its free cash flow yield is above that of the S&P 500.
Schlumberger: Earnings, Valuation, Dividend, Free Cash Flow Outlooks
BofA Global Research
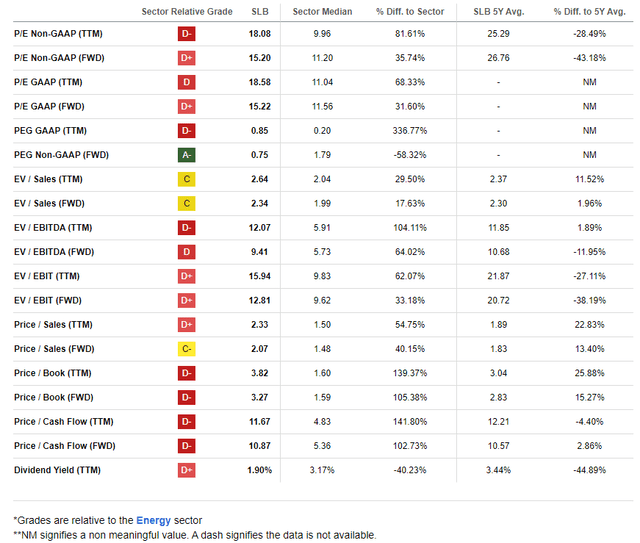
If we assume 2025 EPS of $4.20 and put a 20 multiple on that, given SLB’s unusually high EPS growth and strong industry position, then shares should be in the mid-$80s by the end of the year, making it significantly undervalued today. Considering that the PEG ratio is just 0.75 on a forward basis – that is incredibly cheap compared to the sector median.
A Deserved Valuation Premium, Very Low PEG Ratio
Seeking Alpha
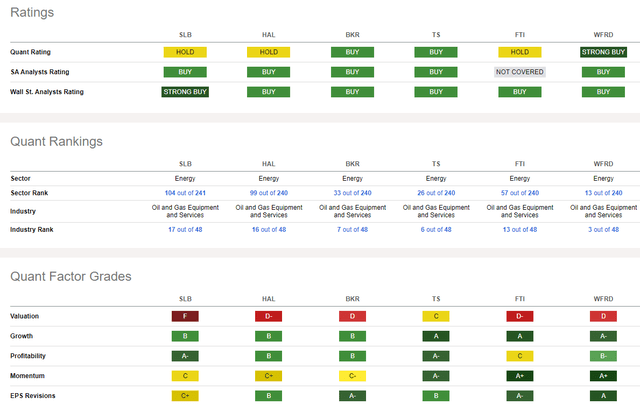
Compared to its peers, SLB sports a valuation premium, but I once again must point out that its PEG ratio is among the better ones you will come across in the large-cap Energy space. EPS growth is indeed a strong point while SLB’s profitability trends are superb. Despite the Q4 beat, Seeking Alpha shows 21 EPS downgrades in the last three months compared with just five upgrades. Share-price momentum has also turned down lately – I will detail the technical situation later on.
Competitor Analysis
Seeking Alpha
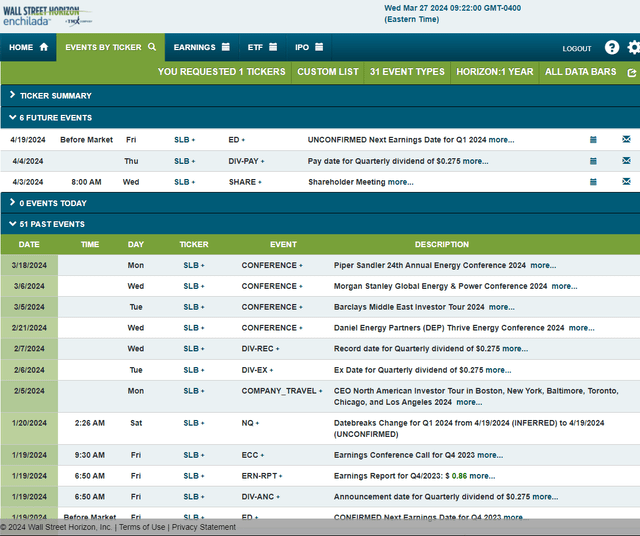
Looking ahead, corporate event data provided by Wall Street Horizon show an unconfirmed Q1 2024 earnings date of Friday, April 19. Before that, volatility could arise during the annual shareholders’ meeting on Wednesday next week.
Corporate Event Risk Calendar
Wall Street Horizon
The Technical Take
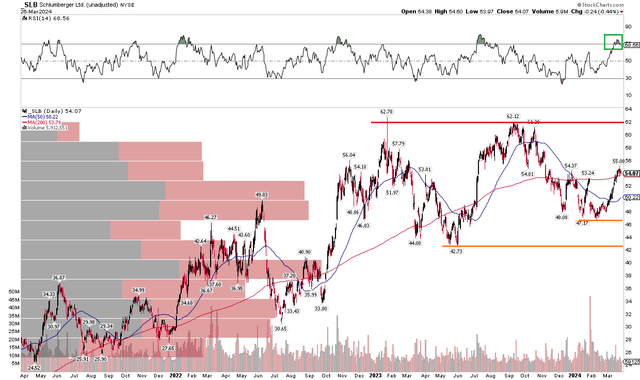
Back in the third quarter of last year, I noted a solid uptrend off SLB’s lows in 2020. Unfortunately, we’ve seen that trendline give way, and a bearish double top between $62 and $63 is a negative sign if you’re long this E&P stock. Notice in the chart below that there is perhaps some support at the $47 mark and another layer of potential buying at the mid-2023 lows just under $43.
Also take a look at the RSI momentum oscillator at the top of the graph – it’s printing fresh highs dating back to July last year – this strong sign of buying activity is a bullish indicator to me. I also like that SLB has, for now, recaptured its flat long-term 200-day moving average and is above its 50-day.
Overall, I would like to see SLB rally above its highs from last year, but if shares dip into the $40s, it would be both a technical and fundamental buy.
SLB: An Emerging Trading Range, Strong RSI Momentum Jump Since Early February
Stockcharts.com
The Bottom Line
I reiterate my buy rating on SLB. I see the stock as significantly undervalued today while its share-price momentum has improved since early February amid the rise in global oil prices. With shareholder-friendly moves and high free cash flow, SLB is an attractive play in the Energy sector.
Read the full article here


