Data this week was about as good as even the most optimistic bull might have hoped for and any remaining bearish technical signals were put to rest with the S&P500’s (SPY) move through 5390-400. There have now been 7 higher closes in a row and it appears a new leg of the bull market is underway.
The early resumption of the rally may be frustrating for many who missed the bottom. I’m unfortunately in this camp – after calling the top and a correction to 5265, I was all set to load up again, but of course the market didn’t give me a nice little dip to buy. The “crash” on August 5th got me overly cautious and I am now underinvested. I’d love to see another big dip, but I’m also looking at alternative ways to buy, even when the S&P500 is approaching its all-time high; it doesn’t tend to give buyers a second chance.
This week’s article will identify new inflection points. These can help keep you on the right side of the trend and can be used to enter trades with minimal risk, even when the market has moved a long way. Various techniques will be applied to multiple timeframes in a top-down process which also considers the major market drivers. The aim is to provide an actionable guide with directional bias, important levels, and expectations for future price action.
S&P 500 Monthly
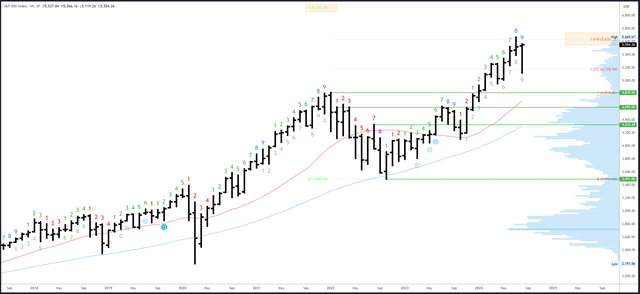
The August bar has not only traded back into the July range above 5390, but is now back in positive territory. There are still 2 full weeks to go until the monthly close, but at this juncture, a bullish bar has formed and only a close below 5390 will shift it neutral/bearish.
I’m slightly surprised at the brevity of the correction in August. The monthly exhaustion took 8-9 months to set up, and came in confluence with a weekly signal and the major Fib extension at 5638. It was a full house of bearish signals and might still have some lingering effects which cap the gains over 5669.
The next major target is the 6124 level. This is a measured move where the 2022-2024 rally will be equal in size to the 2020-2022 rally. It is unlikely to be reached this side of the election, but is a possible destination at some point in this bull market.
SPX Monthly (Tradingview)
5638 and the 5669 are major resistance points.
5390 and the August low of 5119 are initial supports.
The August bar will complete the upside Demark exhaustion count. It may have played out already with the correction of nearly 10%, but its effect could linger and limit rallies ahead of the election.
S&P 500 Weekly
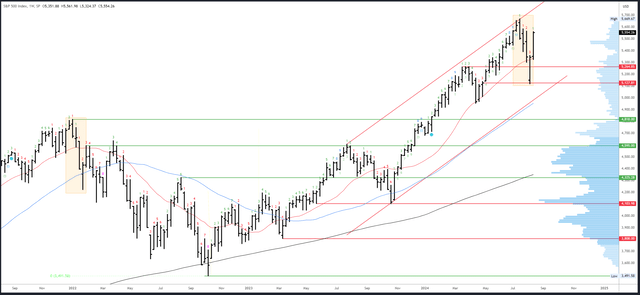
Last week’s article highlighted the need for a “higher low, higher high and higher close over 5344, ideally 5400” to confirm a reversal. These were provided emphatically in a very bullish weekly bar. The close at the highs suggests the rally will follow through early next week.
The comparison with the initial drop from the 2022 top (highlighted) is still valid, but less compelling with this week’s strong action. A large drop next week would be needed to keep this comparison relevant,
SPX Weekly (Tradingview)
Initial resistance comes in at 5566 and is likely to be tested early next week.
The 20-week MA and low of last week are initial support at 5324.
Next week will be bar 2 (of a possible 9) in a new upside Demark exhaustion count.
S&P 500 Daily
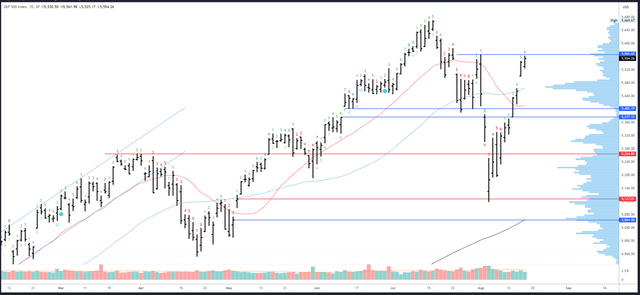
The S&P500 is nearly back where the 3-day crash (if we can call it that) originated at 5566. It’s obvious resistance, but so was the 5390-400 area which was cut through last week like it was nothing. This is similar action to early November ’23 and to early May ’24 when the rally gapped over resistance points and maintained strong momentum.
Rallies tend to slow when they reach the area of the preceding top and a clean break of 5669 looks unlikely. Expect shallow dips until this level is reached.
SPX Daily (Tradingview)
5566-85 is the first resistance, then the 5669 peak.
On the downside, the gap at 5500 is potential support, followed by 5463-70 at the high volume area. The 5390-400 area is still relevant; a break below this level would put the recovery into question.
An upside Demark exhaustion will be on bar 7 (of 9) on Monday. A reaction is often seen on bars 8 or 9 which means a pause/dip gets more likely from Tuesday onwards.
Drivers/Events
The data was so good this week, a 50bps cut in September has been priced out and the odds of a 25bps move have risen to 75%. US Core PPI came in at 0.0% when 0.2% was expected, CPI stayed at 0.2%, but most important of all, Unemployment Claims came in lower than expected at 227K, some way from the danger area of 250K. Panic over the labour market seems premature. Importantly, yields moved lower again, this time for the right reasons (low inflation).
Data next week is on the quiet side and should allow the current move higher to continue. FOMC Minutes are due for release Wednesday while Thursday will bring PMIs and Unemployment Claims – the stronger the better for the S&P500. Fed Chair Powell is scheduled to talk at the Jackson Hole Symposium on Friday. While no surprises are expected, it will be interesting to hear the Fed’s view on recent events; will they push back on the dovish repricing and expectations for aggressive cuts? Probably not.
While the data may be positive, concerns over valuations, the economy and the election could cap the upside. Remember the July top formed on good news (CPI), and the August bottom came when things looked their worst. The reaction to data often depends on the technical context (positioning).
Probable Moves Next Week(s)
The bullish bigger picture view is firmly intact and it seems the expected H2 correction has played out already. New all-time highs are expected in the coming weeks, although the trend above 5669 may be limited by the continued effect of the monthly exhaustion signal and concerns over the labour market/economy. Election uncertainty is also likely to cap rallies. I’m anticipating an initial break of 5669 will fail and then lead to a much slower drift higher to form a wedge pattern.
Short-term, resistance at 5566-85 should be reached early next week. A daily exhaustion signal should then lead to a pause and dip, but 5500 ideally holds to set up continuation to 5669 where a longer consolidation is likely. Assuming this scenario plays out reasonably well, I would buy near 5500 and add if 5463-70 is reached.
Should 5390-400 break, it would mean my conclusions of a strong move to 5669 are wrong and the S&P500 is still in a correctional phase. Although this would be disappointing, it could provide an opportunity to buy during a deeper dip and I may get a second chance after all.
Read the full article here


