Fundamentals:
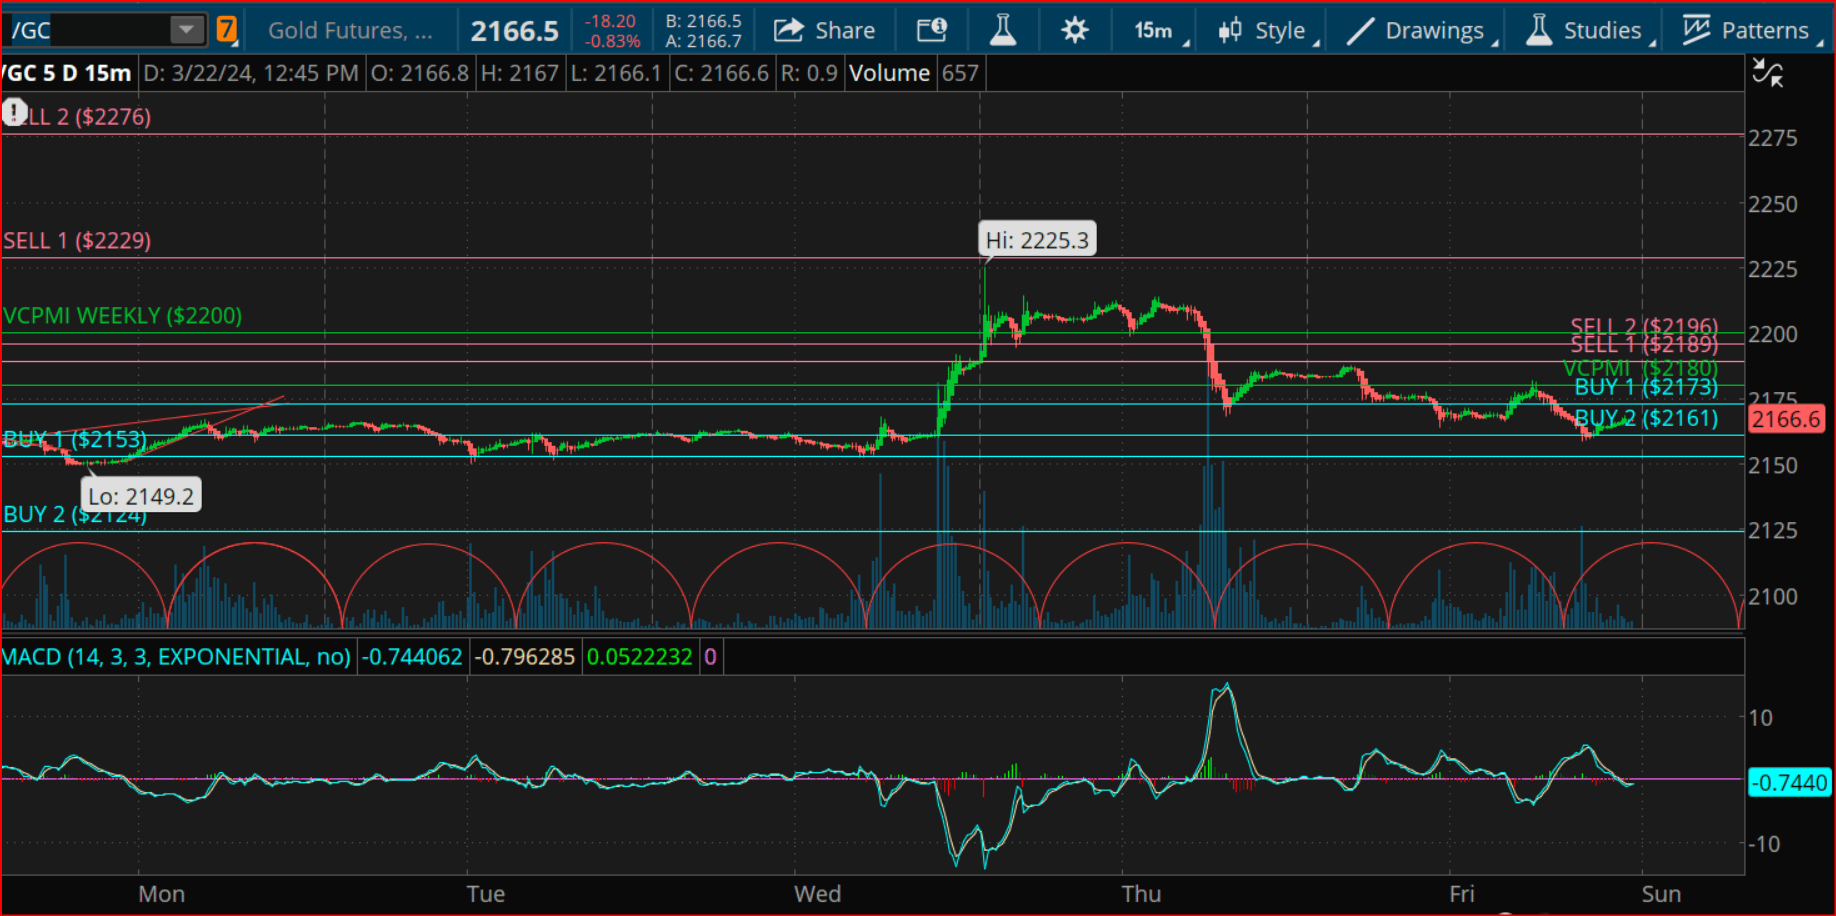
This past week, gold prices went up and down a lot, hitting new highs over $2200 per ounce at one point. This was all happening around a big meeting by the Federal Reserve, which is like the central bank of the United States. They talk about and decide on things like interest rates, which can really affect how much things cost and how the economy is doing.
What Happened This Week?
- Interest Rates: The Federal Reserve didn’t change interest rates this past week, which most people were expecting. They’ve hinted they might lower them later this year to help the economy grow more easily.
- Gold Prices: Right after the Fed’s meeting, gold prices shot up. They went really high in the US and then even higher when Asian and European markets opened. This shows that people are still really interested in buying gold, especially when they’re not sure about the economy.
- Why Gold Went Up: Even though the Fed said it might cut rates later, people are worried they might wait too long to do it, which could hurt the economy. Gold is often seen as a safer place to put your money in uncertain times, so more people want it when they’re worried.
After the Meeting
After the initial excitement, gold prices came down a bit as people started buying US dollars again, thinking they might get more valuable. But, gold still stayed pretty high, showing that people think it’s a good thing to have right now.
Looking Forward
There’s not much bigger economic news expected soon, so what happens next might depend a lot on how people feel about the economy and what they think the Fed will do about interest rates. Gold is still popular because it’s seen as a safe thing to own when people are unsure about the future.
In simpler terms, this week was all about how people reacted to what the Federal Reserve said and did, and how that made the price of gold go up and down. People are watching closely to see what might happen next, both with interest rates and with the economy in general.
Let’s examine next week’s standard deviation report and see if we can identify any short-term trading opportunities.
GOLD: Weekly Standard Deviation Report
Mar. 24, 2024 9:27 AM ET
Summary
- Gold futures contract closing well above the 9-day SMA indicates strong bullish momentum in the short term.
- Closing above the VC Weekly Price Momentum Indicator further confirms the bullish sentiment in the market.
- Tactical approach of taking profits on short positions at corrections within specific levels allows traders to capitalize on minor pullbacks.

weekly gold (tos)
Trend Momentum and SMA (Simple Moving Average)
The significance of the gold futures contract closing at 2182, well above the 9-day SMA of 2110, cannot be overstated. This indicates strong bullish momentum over the short term. The 9-day SMA serves as a dynamic support level; as long as prices remain above this average, the short-term trend is considered bullish. A close below this average would suggest a weakening of bullish momentum, potentially shifting the market sentiment to neutral. This is crucial for traders to monitor, as the SMA is a lagging indicator that reflects past price movements, providing insights into the market’s direction.
Price Momentum and VC Weekly Price Momentum Indicator
Closing above the VC Weekly Price Momentum Indicator at 2200 further corroborates the bullish sentiment in the market. This indicator is designed to identify the momentum within the market, signaling the strength behind the price movements. If the market were to close below this level, it would indicate a loss of bullish momentum, potentially leading to a sideways or neutral market condition. For traders, this indicator is a vital tool for assessing the market’s health and determining the robustness of the current trend.
Profit-Taking Levels and Strategy
The advice to take profits on short positions at corrections within the 2153–2124 levels suggests a tactical approach to capitalize on minor pullbacks within a broader bullish trend. This strategy allows traders to secure gains from short-term fluctuations while maintaining a longer-term bullish outlook. For those considering long positions, the recommendation to initiate these on a weekly reversal stop provides a method to enter the market at potentially more favorable prices, ensuring a better risk-reward ratio.
Stop Loss and Profit Targets for Long Positions
Setting a weekly Stop Close Only (SCO) and Good Till Cancelled (GTC) order at the 2124 level for long positions acts as a risk management technique, safeguarding against unexpected market downturns. The specified profit targets at the 2229–2276 levels are set with the expectation of continuing bullish momentum, offering traders predefined exit points to lock in profits before any potential reversal in trend.
Cycle
The mention of the next cycle due date as March 28, 2024, introduces the concept of cyclical analysis into the trading strategy. This approach is based on the idea that markets move in cycles, and that these cycles can provide clues about potential turning points or continuation patterns in the market. Traders might use this date to reassess their positions, expecting increased volatility or significant price movements around this time.
Overall Strategy and Market Sentiment
The overall strategy emphasizes a bullish outlook on gold futures, with specific tactics for both entering and exiting positions. It incorporates a mix of technical indicators and cyclical analysis to guide trading decisions. However, it’s essential for traders to remain vigilant and responsive to real-time market changes. Markets are dynamic, and while historical data and technical analysis can provide valuable insights, external factors such as geopolitical events, economic data releases, and changes in monetary policy can also significantly impact market sentiment and price movements.
By understanding and applying these concepts, traders can develop more nuanced and adaptable trading strategies, enhancing their ability to navigate the complexities of the gold futures market.
Read the full article here


