Thesis
Despite being renowned as a growth investor, Peter Lynch has been very successful in picking dividend stocks also. And he has shared valuable insights extensively throughout his career and writings regarding the selection of dividend stocks. While some of his advice has become common knowledge now (such as the importance of consistent and preferably low payout ratios), some of his criteria are very insightful even for veteran DGIs (dividend growth investors).
In this article, I have gathered a total of 5 screening criteria from Lynch’s writings and will apply them to Walgreens Boots Alliance (NASDAQ:WBA) and CVS Health Corporation (NYSE:CVS). You will see that the final conclusion is that WBA scored a total of four points out of these 5 criteria while CVS scored 3 points. And for those who are eager to see the final scorecard, it is at the end of the article.
Before we dive in, here is the list of the five criteria that I’ve gathered and a brief background for each of them:
- Dividend track record. This is one is self-explaining and common knowledge to DGIs. A long track record of consistent dividend payout is a sign of a stable moat. And Lynch favors companies with a track record of 20 to 30 years.
- Valuation. Lynch is known for his use of the PEG ratio (P/E ratio divided by the earnings growth rate). For dividend stocks, he uses a revised version of the PEG ratio – the PEGY ratio, which is defined as the P/E ratio divided by the sum of the earnings growth rate and dividend yield. And similar to the PEG ratio, his preference is a PEGY ratio below 1x.
- Payout ratio. This is one is also self-explaining. A lower payout ratio is preferable.
- Share buybacks. This is an area most DGI do not emphasize enough even though share buyback yield is as important and as real as cash dividend (probably even better-considering tax implications). And Lynch not only recognizes the dollar value of share repurchases, but he also relies on it as a sign of management confidence in their business.
- Inventory management. This is also another area that many DGIs overlook. Lynch’s insight is that inventory data provide one of the most reliable indicators for a business’ growth potential and financial health.
1. Dividend track record
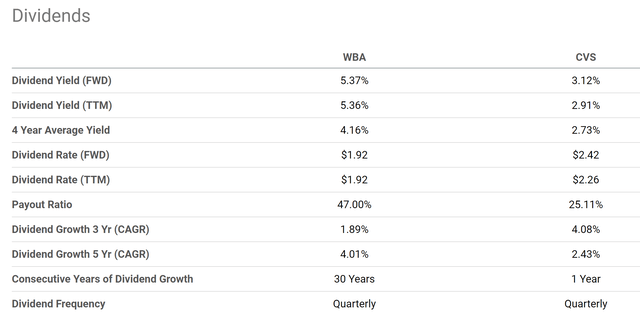
As just mentioned, the first criterion is the dividend track record, with Lynch favoring companies with a long record of regularly raising dividends, preferably 20 to 30 years. In this regard, WBA is the clear winner. It is a member of the elite dividend champion club and has an impressive track record of consecutively increasing its dividend for 30 years, as shown in the chart below. On the other hand, CVS’ dividend growth was interrupted in 2017 (due to the acquisition of Aetna) and only resumed in 2021. As a result, WBA scores one point higher than CVS on the track record criterion.
Source: Seeking Alpha data
2. Valuation
As aforementioned, for valuation, we will use Lynch’s revised PEG ratio: the PEGY ratio. To compute the PEGY ratio, we first need to estimate the earning growth rates. Here I will use the 5-year growth rate of their dividends to represent the earnings growth rates. To me, a period of 5 years is long enough to filter out short-term noises, and dividends are a good measure of the owners’ earnings. As you can see from the chart above, WBA has been also growing its dividend at a higher rate than CVS in the past 5 years. To wit, WBA’s 5-year CAGR dividend growth rate is about 4.01%, compared to CVS’ 2.43%.
Then we need their P/E ratios and dividend yields. As shown in the chart below, WBA is currently priced at an FY1 P/E ratio of 7.94x, whereas CVS is slightly higher at 8.79x. As a result, the PEG ratio for WBA is about 1.98x, substantially below CVS’ 3.62x (see the second table below). And finally, the FW dividend yield for WBA is about 5.37%, and for CVS is about 3.12%. When the FW yield is added to the growth rate, WBA’s PEGY ratio turns out to be only 0.85x and CVS’ PEGY ratio about 1.58x.
So, WBA’s PEGY ratio is substantially lower than the 1x threshold that Lynch prefers, while CVS’ ratio is 58% higher than this threshold. As a result, WBA scores another point over CVS in the valuation criterion.
Source: Seeking Alpha data Source: Author based on Seeking Alpha data
3. Dividend payout ratios
The payout ratios, either in terms of earnings-based payout ratios or cash-based, appear quite choppy in both stocks as seen in the chart below. Part of the reason for such large fluctuations is that their accounting earnings do not always reflect their economic earnings. However, despite the large variance in the data, my conclusion here is that CVS’ has been featuring a payout ratio that is substantially lower than WBA. The top panel compares their cash payout ratios in the past 10 years to damp out the noise and average out the discrepancies between accounting earnings and economic earnings. To wit, WBA has historically paid out a 38.6% of its cash as dividends compared, while CVS only paid out 24.5%. Moreover, WBA’s current payout ratio is 47%, also significantly higher than CVS’ 25% if you recall from the data shown in the first chart above.
Thus, CVS undoubtedly scores one point above WBA in terms of payout ratios.
Source: Seeking Alpha data
4. Share buybacks
Both stocks have been consistent buyers of their own shares over the years, as illustrated in the next chart below. To wit, CVS’ net common buyback yield has been on average 2.79% over the past decade. In comparison, WBA’s net common buyback yield has been substantially higher at an average of 3.43% over the past decade. Although CVS’ current net buyback yield is substantially higher than WBA’s (3.52% vs 0.49%).
Given the above considerations, I consider the comparison here a bit mixed and that it is tied for them in terms of share buybacks. Each of them will get 1 point because they both have a long track record of buying back their own shares.
Source: Seeking Alpha data
5. inventory management
Finally, the following chart compares their inventory management. More specifically, the chart shows the days of inventory outstanding for WBA and CVS in recent years. As shown, both companies have been steadily improving their inventory management over the years. WBA has reduced its outstanding inventory from ~48 days at the beginning of the past decade to the current level of 29 days only. Meanwhile, CVS has shrunk its inventory from ~39 days to the current level of 24.2 days over the same period.
All told, both companies have demonstrated a similar trend of inventory improvement and their current levels are very similar. As such, I also consider this criterion a tie between CVS and WBA.
Source: Seeking Alpha data
Risks and final thoughts
Before issuing my final scorecard, it is important to remind investors that both stocks entail risks despite their leading position in the healthcare space. Being in the same sector, CVS and WBA directly compete against each other and are sensitive to the same set of macroeconomic conditions and policies. Macroeconomic conditions such as the COVID pandemic and high inflation rates could impact the business model of both companies. In terms of policy risks, both companies are particularly sensitive to reimbursement policies. For example, the recent enactment of the Inflation Reduction Act (“IRA”) could have long-term implications for WBA and CVS. Finally, WBA is also more susceptible to currency exchange risks due to its larger global exposure than CVS.
In summary, both WBA and CVS are attractive under their current conditions according to Lynch’s criterion for picking dividend stocks. As shown in the table below, CVS met 3 out of the 5 screening criteria, and WBA met a total of 4 of them. In particular, WBA’s PEGY ratio is only 0.85x, below Lynch’s threshold of 1x by a good margin.
Source: Author based on Seeking Alpha data
Read the full article here


