InvenTrust Properties (NYSE:IVT) is a relatively small, 63-property shopping center real estate investment trust (“REIT”), but I would argue that it is the highest quality one in its peer group.
IVT boasts the highest share of its portfolio located in the Sunbelt, among the highest share of its portfolio being grocery-anchored centers, and the lowest leveraged balance sheet in its retail REIT peer group.
IVT May Presentation
And though I’m not necessarily complaining about the other retail REITs’ governance practices, I particularly like that IVT separates the roles of CEO and Chairman of the Board. The CEO, DJ Busch, primarily gained experience at Green Street, which is a commercial real estate research outlet notorious for its emphasis on good governance practices. And the Chairman of the Board is Julian Whitehurst, the former CEO of National Retail Properties, now called NNN REIT (NNN).
In my last article on IVT from December 2023 (and in others preceding it), I described IVT as a low-risk, steady compounding essential retail REIT. For whatever reason, IVT has been rangebound since I started covering it. The stock price has gone nowhere, even as the fundamentals keep getting better. To me, that incrementally increases its attractiveness as a buy.
IVT is not the cheapest shopping center REIT, nor is it the highest yielding. In fact, the opposite is true. It is one of the higher multiple names in its peer group, and its dividend yield of 3.7% is among the lowest.
But I would argue that IVT more than earns its premium valuation. For long-term investors aiming for maximal total returns and dividend growth, I believe IVT is the best pick in the space.
Why IVT Is The Only Shopping Center REIT I Own
Shopping center REITs have been a poor performing asset type in recent history. In the first half of the 2010s, retail suffered from an oversupply of space from overbuilding in the 2000s and an economic bust during the Great Financial Crisis.
Then, in the second half of the 2010s, e-commerce struck the brick-and-mortar retail space, and store closures significantly outpaced store openings.
Shopping center landlords slowly increased rent rates over the 2010s, but tenant turnover was also fairly high. Landlords had to invest a lot of capex into their centers. Tenant improvement costs, leasing commissions, and rent concessions prevented shopping center REITs from achieving much bottom-line cash earnings growth.
The only upside was that shopping center construction fell off a cliff after the GFC and never rebounded back to pre-GFC levels.
JLL Research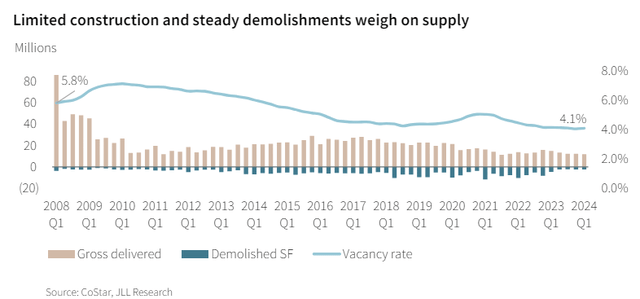
Even today, there’s essentially no new development of shopping centers because rent rates and NOIs have not risen enough to make projects pencil out. Retail rents have been growing quite swiftly over the last year or so, but construction costs and interest rates are also much higher than they were several years ago.
Green Street forecasts that there will be essentially no growth in the development pipeline of shopping centers over the next five years. In fact, they estimate that there will be even less supply growth for retail space than for office space.
IVT May Presentation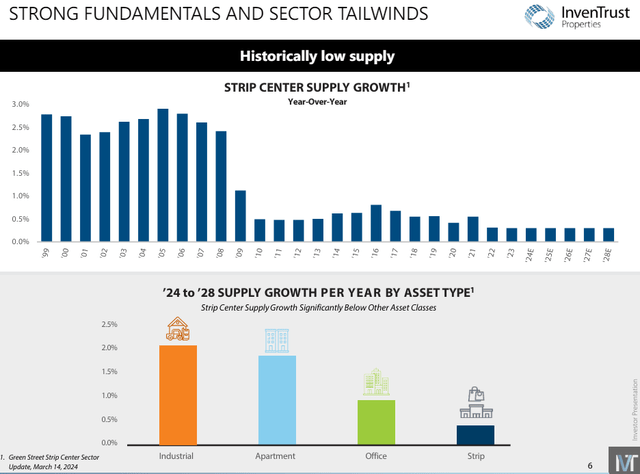
Rather than retail sector weakness, what this signifies is just how much space rent rates have to run before new construction becomes profitable for developers again.
What I find particularly interesting is that, unlike in the multifamily space, retail supply growth is low even in the Sunbelt markets that have enjoyed rapid growth over the last several years.
With Sunbelt retail real estate, you get all the benefits of population growth with none of the competition from new supply.
CoStar data shows that the US markets enjoying the fastest retail rent growth (in Q1, 2024) are almost uniformly located in the Sunbelt.
CoStar via JLL Research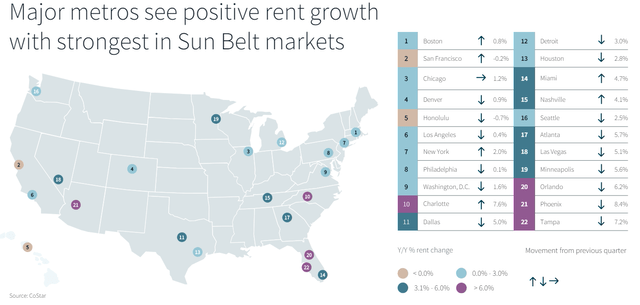
Phoenix, Charlotte, Tampa, and Orlando are enjoying particularly fast market rent growth. These are all IVT markets.
IVT May Presentation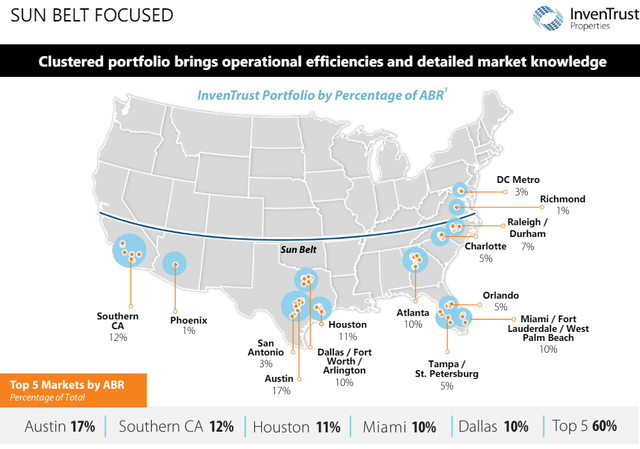
Will this Sunbelt outperformance continue? Pretty much every third-party expert that performs forecasts thinks so.
Below, we find that 8 of the top 10 markets for projected retail NOI growth from 2024 to 2028 are located in the Sunbelt. And IVT’s top market of Austin, TX (17% of total NOI) is predicted to have the best growth over the next five years.
IVT May Presentation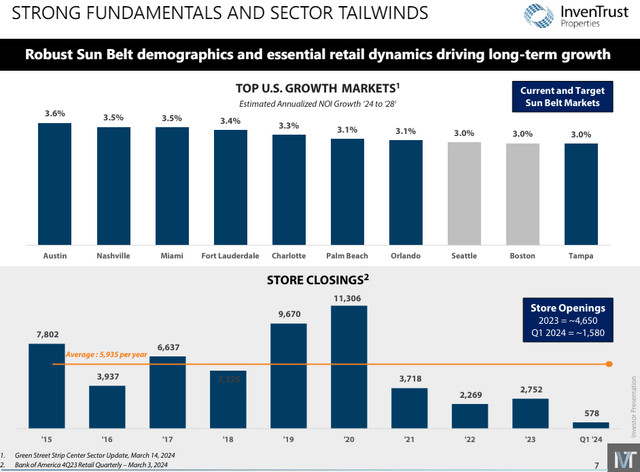
Notice also from the image above that retail store closures have declined to very low levels, while openings have vastly outpaced closings over the last few years.
Fewer store closures and more store openings means a few very positive things for retail REITs like IVT.
First, it means higher occupancy. Returns obviously get better and better the higher a center’s occupancy and the lower its vacancy.
IVT’s occupancy rate has jumped up from 92.8% in 2020 to 96.3% in Q1, 2024.
Second, it means higher retention and more lease renewals. Though new leases tend to come with the biggest nominal rent growth rates, they also come with the most tenant improvement (buildout) costs and leasing commissions. Most of the time, it’s more profitable for the landlord to accept less rent growth from a renewal than to get higher rent but also more costs from a new lease.
The same principle is true for virtually all types of real estate.
Plus, higher tenant retention signifies that tenants are operating successfully — and customers are enjoying their presence — in the shopping center. Successful tenants mean steady foot traffic, which tends to have beneficial effects for other tenants in the center in a virtuous cycle.
Comparison To Peers
Let’s compare IVT’s recent performance metrics to that of its peers. Here are the shopping center REIT peers used for comparison:
- Regency Centers (REG)
- Federal Realty Trust (FRT)
- Brixmor Property Group (BRX)
- Phillips Edison & Company (PECO)
- Retail Opportunity Investments (ROIC)
- Kimco Realty (KIM)
- Whitestone REIT (WSR)
- Kite Realty Group (KRG)
We’ll start with occupancy rates, arranged from highest to lowest as of Q1 2024:
| Q1 2024 Occupancy | |
| PECO | 97.2% |
| ROIC | 96.4% |
| IVT | 96.3% |
| KIM | 96.0% |
| REG | 95.8% |
| BRX | 95.1% |
| FRT | 94.3% |
| KRG | 94.0% |
| WSR | 93.6% |
Though IVT’s occupancy is not quite as high as that of PECO or ROIC, note a few things.
First, IVT’s portfolio is a higher quality as measured by TAP score than that of PECO. TAP stands for “trade area power” and is a Green Street metric used to measure the demographic and economic quality of the surrounding area. IVT’s portfolio tends to be located in more affluent and densely populated areas than PECO’s.
Second, though ROIC enjoys strong demographics with its West Coast grocery-anchored portfolio, it is less diversified or Sunbelt-oriented than IVT.
Also, both PECO and ROIC have meaningfully higher leverage levels than IVT.
Now, let’s look at some recent organic and bottom-line growth metrics, arranged from highest to lowest Q1 same-store NOI growth:
| 2023 SSNOI Growth | Q1 2024 SSNOI Growth | Q1 2024 FFO/Sh Growth | |
| BRX | 3.1% | 5.9% | 8.0% |
| ROIC | 3.7% | 5.7% | 12.0% |
| IVT | 4.9% | 4.1% | 9.8% |
| KIM | 3.2% | 3.9% | 0% |
| FRT | 4.3% | 3.8% | 3.1% |
| PECO | 4.2% | 3.7% | 4.9% |
| WSR | 2.7% | 3.1% | 0% |
| REG | 3.6% | 2.1% | 1.0% |
| KRG | 4.8% | 1.8% | -2.0% |
BRX did generate much stronger SSNOI growth in Q1 2024, but the REIT has more of a focus on value-add investments than IVT. In this environment, BRX’s value-add investments have paid off handsomely, but keep in mind that it is paying for this growth via capex.
Meanwhile, ROIC has been taking advantage of its high occupancy rate to push rents, as it should.
In both cases, it is good to keep in mind that virtually all retail real estate across the country has enjoyed a nice boost from cash-rich consumers over the last few years. Going forward, city-based fundamentals and demographics will play a much larger role. I believe IVT enjoys an advantage in this department.
When it comes to the balance sheet, IVT boasts the lowest level of leverage based on 2024 EBITDA estimates.
IVT May Presentation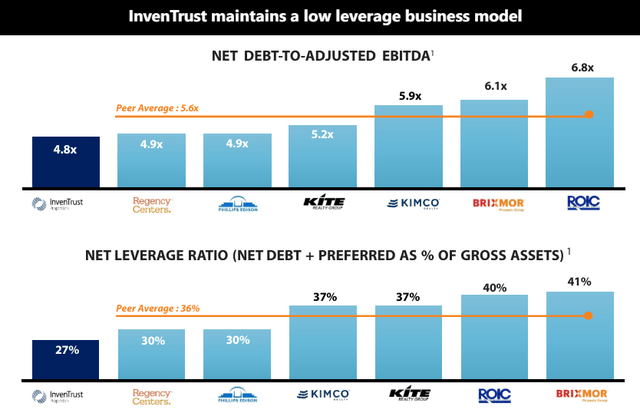
Even though IVT’s credit rating is “only” BBB-, its leverage metrics are actually slightly lower than the A-rated Regency Centers.
Finally, and tellingly, note that IVT is only one of three retail REITs that raised its dividend through the COVID-19 pandemic — and IVT’s dividend hike, though not huge, was the most substantial.
| Dividend Status During COVID-19 | |
| IVT | Raised (2.7%) |
| REG | Raised (<1%) |
| FRT | Raised (~1.0%) |
| KIM | Cut |
| BRX | Cut |
| ROIC | Cut |
| WSR | Cut |
| KRG | Cut |
| PECO | N/A (IPO’d in 2021) |
From 2016 through 2021, IVT’s dividend grew 2 pennies per year, averaging 2.5-3% annually. If the years weren’t labeled below, you wouldn’t be able to tell when the pandemic was.
IVT May Presentation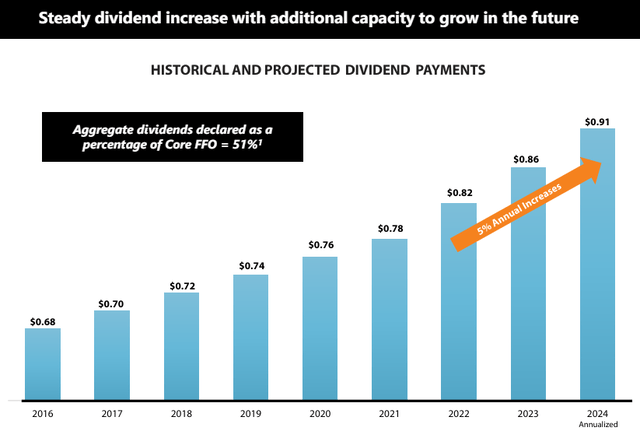
Then, from 2022 onward, IVT’s dividend growth has increased to about 5% per year. And yet, in 2024, the payout ratio remains 51% of core FFO, 64% of AFFO, and 67% of free cash flow.
(AFFO includes necessary capex such as tenant buildouts and leasing commissions, while FCF includes both necessary and growth capex such as development/redevelopment projects.)
I know many REIT investors will pass on IVT because of its relatively low 3.7% dividend yield. But you must understand that the reason the yield is so low is that IVT retains 1/3rd of its cash flow. This gives the REIT greater optionality, as management can choose to allocate that cash to growth investments, deleveraging, or whatever else will generate the best returns.
Bottom Line
IVT’s focus on high-quality, well-located, grocery-anchored shopping centers in fast-growing Sunbelt markets makes it a highly appealing investment. The fact that its balance sheet is also among the strongest in its peer group seals the deal for me.
I believe its high-retention, low-maintenance centers should generate best-in-class organic growth over the next five years. And IVT’s low debt level should prevent rising interest expense from significantly offsetting that organic NOI growth.
As a long-term dividend growth investor with the goal of owning the highest quality leaders in their respective niche of the economy or real estate, I am an enthusiastic shareholder of IVT.
I believe IVT’s same-store NOI, FFO per share, and dividend growth should be at or near the top of its peer group over the next five years.
Read the full article here


